CNXSMALLCAP & MIDCAP – Chart Analysis
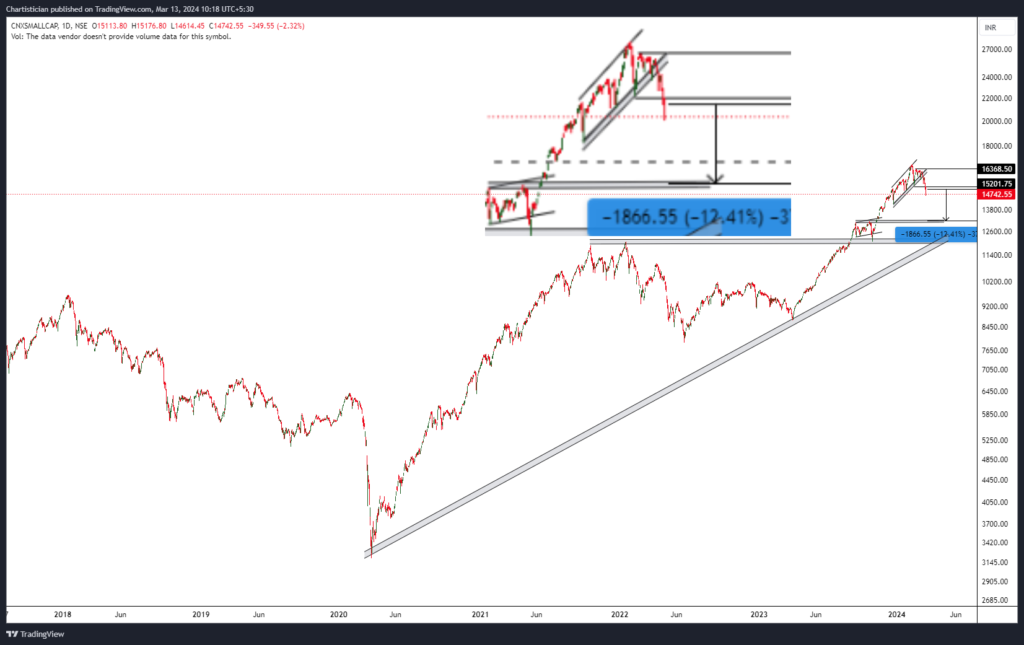
So it all boils down to simple method for trend identification. A bullish rally setup which has been making higher high and higher lows has breached its previous higher low indicating we are in for some sideways to corrective phase. A new lower low indicate impending correction, but, till what levels? Another approach in technical […]
Narayana Hrudayalaya – 20% Upside?
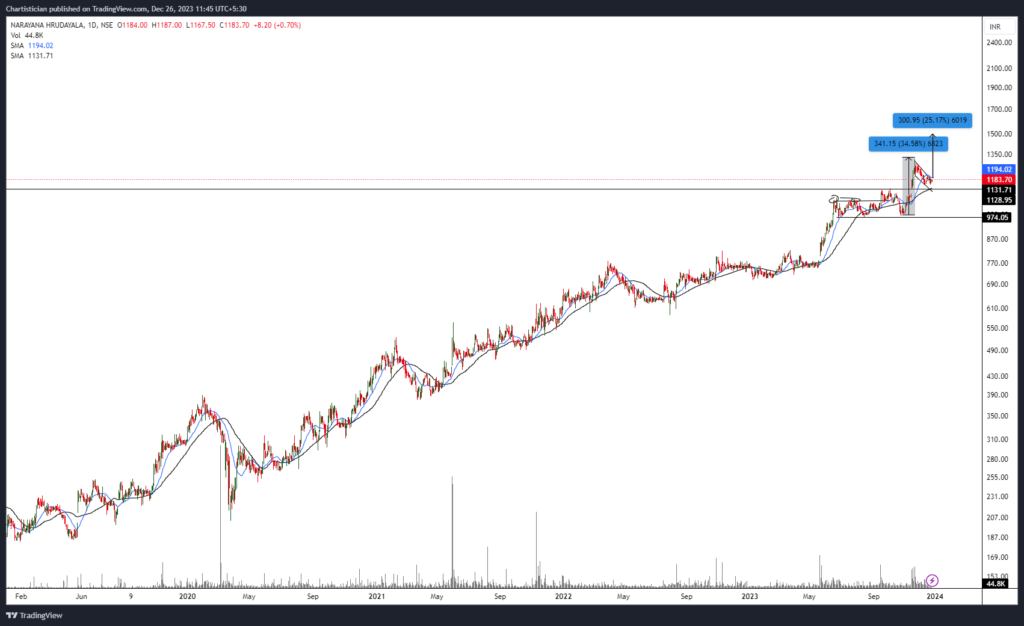
NH is retracing for a Dip further to extend the bullish rally to the new ATH. The chart structure is a classic example of how stock consolidates and moves out to break and how previous resistance becomes support. After the breakout from a rectangular pattern, the stock rallied towards 1,300 odd levels and, at present, […]
Railway Stocks and IRFC.NSE / IRFC

This one stock has probably made many some good amount of money(including our clients and myself) and has given many the worst feeling one can have in the market; the F.O.M.O. Yes, The Fear Of Missing Out is one decision that brings in regret which is not addressed in even behavioral finance and at the […]
SBIN – The Leader of PSUs
SBIN.NSE, State Bank of India, one of the largest and leading PSU banks, has recently given a breakout on weekly and daily scales, indicating the current bullish run would have it as one of the leaders. The breakout above 621, Gap Up, Volumes, ADX, and all other variables indicate this to sustain in the coming […]
Stock Analysis – Cochin Shipyard, cochinship.nse
A new bullish leg in Cochin Shipyard is visible as the stock prices form a saucer pattern. The saucer pattern, a rounding bottom, is a technical analysis pattern resembling a “U” on a price chart. It signifies a gradual transition from a downtrend to an uptrend in an asset’s price. This pattern suggests a reversal […]