
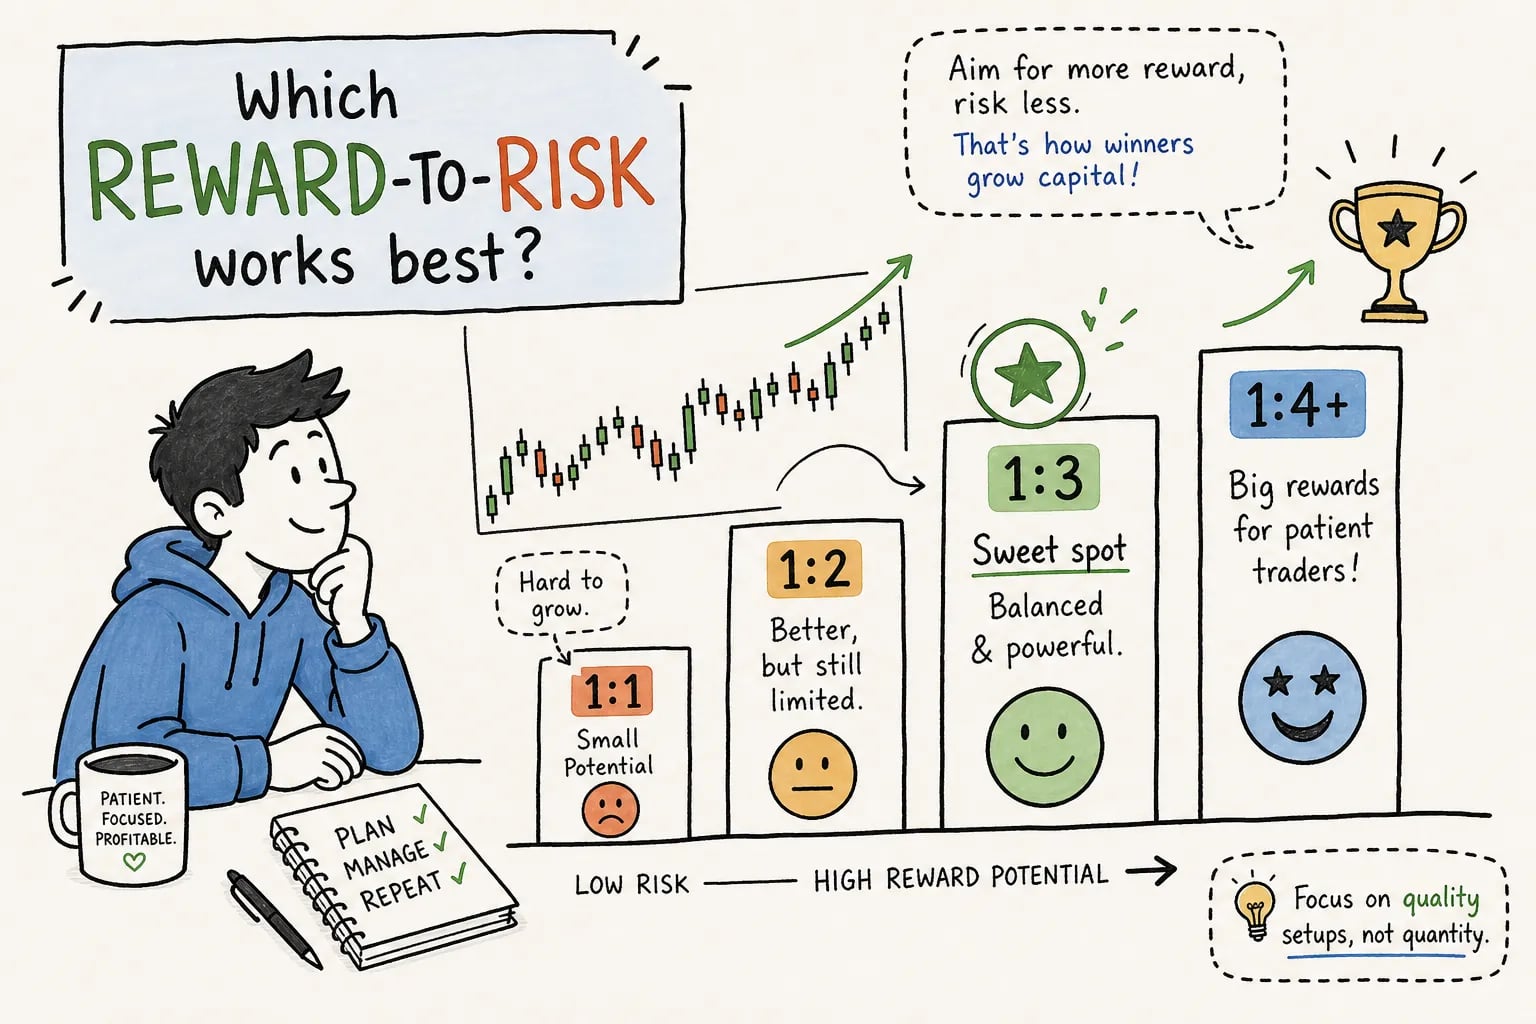
Many retail traders ask: what is a good reward to risk ratio for swing trades? They assume winning more often is the same as making more money, and so they chase systems that win 60%, 70%, even 80% of the time. It is not the same. A system that wins frequently but earns small amounts can easily be outperformed by a system that wins less than half the time but earns substantially more on each winning trade. The number that shapes whether your strategy is profitable over time is not win rate in isolation, it is the reward-to-risk ratio working in combination with expected value, and getting it right is the foundation of every consistent swing trading system.
At Finversify, every equity swing call is structured with a pre-defined reward-to-risk threshold before the alert reaches subscribers. That discipline is not an accident; it is the structural reason a strategy can survive losing streaks and still compound returns over time. By the end of this article, you will know how to select the right ratio for your swing setups, calculate expected value, place stops and targets with precision, and size positions so a bad run of trades does not destroy your account.
What is a good reward to risk ratio for swing trades? Start with expected value
The expected value formula, explained plainly
Expected value (EV) is the single calculation that reveals whether a trading system has a genuine mathematical edge. The formula is straightforward: EV equals (Win Rate multiplied by Average Win) minus (Loss Rate multiplied by Average Loss). A positive EV means your system makes money over a large sample of trades. A negative EV means it loses money, regardless of how confident you feel about individual setups.
What this formula makes clear is that a strategy can be ‘right’ less than half the time and still produce consistent profits, provided the wins are large enough relative to the losses. Win rate and reward-to-risk are two separate levers, and profitability depends on both, not on win rate alone.
The 40% vs 70% comparison that changes how you think
Consider two traders. Trader A wins 40% of the time with a 3:1 reward-to-risk ratio. Trader B wins 70% of the time but only captures 0.5 times the risk on each winner. Run the numbers: Trader A’s EV is (0.40 × 3) minus (0.60 × 1), which equals +0.60R per trade. Trader B’s EV is (0.70 × 0.5) minus (0.30 × 1), which equals only +0.05R per trade.
Trader A, who loses six trades out of every ten, earns twelve times more per trade than Trader B, who wins seven out of ten. The average win size matters as much as, and often more than, how often you win. This single insight reframes how you should evaluate every swing setup you consider taking.
What is a good reward to risk ratio for swing trades? The benchmarks that hold up
The break-even win rate for each ratio
There is a clean formula to calculate the minimum win rate a strategy needs to avoid losing money: break-even win rate equals 1 divided by (1 plus the reward multiple). This gives you a concrete floor to measure your actual win rate against.
The key reference points are as follows: a 1:1 ratio requires a 50% win rate to break even; a 1:2 ratio requires only 33.3%; a 1:3 ratio requires just 25%. At 1:3, you can lose three out of every four trades and still not lose money. That structural cushion is significant for swing traders who face unpredictable short-term price noise, gaps, and false breakouts that are simply part of the game.
Why 1:2 is the floor and 1:3 is the preferred target
A 1:2 ratio is the practical minimum for swing trading because it provides enough margin to absorb brokerage costs, STT, slippage, and a normal run of losing trades without eroding your equity. When you factor in real transaction costs on Indian exchanges, brokerage, STT, GST, stamp duty, and slippage, a gross 1:2 setup can see its net ratio compressed meaningfully. That is still workable, but it leaves limited room for a bad streak, which is why targeting 1:3 wherever the chart structure allows is the stronger discipline.
A 1:3 ratio demands only a 25% break-even win rate, which most swing setups with a genuine directional edge can comfortably exceed. A 1:1 setup, by contrast, is a structural trap: after transaction costs, it may already be negative in expectancy before a single trade is taken. If you find yourself regularly accepting 1:1 setups because ‘it looks good,’ you are trading on conviction rather than edge.
How to place your stop-loss and target with precision
Structure-based stops: start with the chart, not a percentage
The correct method is to identify the nearest meaningful swing low, support zone, or breakout base on the daily chart, and then place your stop just below that level with a small buffer. The buffer exists because stops placed directly on round numbers or exact support levels are more exposed to normal price oscillation, price routinely tests those obvious levels before continuing in the intended direction. Consider a mid-cap NSE stock entered at ₹500 where the nearest support sits at ₹480: a reasonable stop placement is ₹477, just below the support with a three-rupee buffer. This gives the trade room to breathe without sacrificing the structural logic behind the stop.
ATR as the volatility sanity check
Once you have a structure-based stop, validate it against the stock’s 14-day ATR on the daily chart. The ATR tells you the stock’s normal daily movement range, and a stop that sits within one ATR of the entry price is almost certainly too tight. Using the same example: if the stock’s 14-day ATR is ₹12, a 1.5x ATR stop sits at ₹482 and a 2x ATR stop sits at ₹476. Both figures converge closely around ₹476 to ₹477, which confirms that the structure-based stop at ₹477 is sound and not artificially narrow.
If the ATR calculation suggests a much wider stop than the structure warrants, the correct response is not to tighten the stop and hope for the best. It is to reduce position size so that the wider stop still fits within your risk budget per trade, a narrowed stop that ignores volatility will simply be hit more often, degrading the system’s actual win rate below what any ratio calculation assumed.
Setting the target so the reward-to-risk ratio works out
With the stop confirmed at ₹477, the risk per share is ₹23 (entry ₹500 minus stop ₹477). A 1:2 target sits at ₹546 and a 1:3 target sits at ₹569. The critical step is to map these projected targets against the nearest resistance levels on the daily chart. If resistance sits at ₹540 but your 1:2 target is ₹546, the trade lacks structural justification for that target level. You either accept the trade at a slightly lower ratio, find a tighter entry to improve the math, or skip the setup entirely.
Position sizing: the number that controls your drawdown
The 1% risk rule and why it works
The 1% rule is simple: risk no more than 1% of your total trading capital on any single swing trade. This is not a conservative suggestion; it is the mechanism that keeps you in the game during the inevitable losing streaks every system produces. On a ₹5,00,000 trading account, 1% risk is ₹5,000. With a stop distance of ₹23 per share, the maximum position size is 217 shares (₹5,000 divided by ₹23). That calculation removes guesswork and prevents the kind of over-leveraging that turns a temporary drawdown into a permanent loss of capital. Experienced swing traders commonly operate in the 0.5%, 1% risk-per-trade range precisely because it keeps individual losses proportionate to the account’s recovery capacity.
What consecutive losses actually cost at different risk levels
The compounded drawdown numbers are worth knowing precisely. At 0.5% risk per trade, five consecutive losses cost approximately 2.49% of capital. At 1% risk, five consecutive losses cost 4.90%. At 2% risk, five consecutive losses cost 9.61%. Extend that to ten consecutive losses and the damage becomes 4.89%, 9.56%, and 18.29% respectively.
Any genuine swing system, regardless of how well it is constructed, will produce losing streaks of four to six trades at some point. Position sizing at 1% or below means those streaks are uncomfortable but survivable. Position sizing at 2% means a ten-trade losing streak wipes out nearly a fifth of your account before you have had a chance to recover. The reward-to-risk ratio and position sizing work together: a strong ratio means fewer wins are needed to recover from each loss, but only if the losses themselves are sized correctly.
A real swing trade example that ties everything together
Building the trade from scratch on an Indian stock
Consider a mid-cap NSE stock in a clear uptrend on the daily chart. Price has pulled back to a prior breakout zone after a three-week rally. Entry is at ₹620, the swing low from the recent pullback sits at ₹596, and the 14-day ATR is ₹15. A structure-based stop at ₹593 (just below the swing low) aligns closely with a 2x ATR stop at ₹590, confirming a sound stop range. Using ₹593 as the stop, the risk per share is ₹27.
On a ₹5,00,000 account at 1% risk, maximum position size is 185 shares (₹5,000 divided by ₹27). The 1:2.5 target sits at ₹687, which aligns with the prior swing high from six weeks earlier, giving the target structural justification. Assuming a 45% win rate on similar setups, the EV per trade is (0.45 × 2.5R) minus (0.55 × 1R), which equals +0.575R. On a ₹5,000 risk budget, that represents approximately ₹2,875 of expected value per trade, a figure that compounds meaningfully across a year of disciplined swing trades.
What the numbers tell you before you place the order
Checking the reward-to-risk ratio before entry is a filter, not a formality. If the nearest resistance is too close to support a 1:2 target, or if the stop required to respect the structure is so wide that position size drops to a trivially small number, the trade simply does not get placed. That objective filter eliminates the marginal setups that feel compelling but lack genuine edge.
The decision framework is replicable every single time. You do not need to read the market perfectly. You need to apply the same structure-based, ATR-validated, reward-to-risk-verified process consistently across dozens of trades, and let the expected value do its work over time.
How Finversify builds this discipline into every swing call
Reward-to-risk defined before the call is sent, not after
Every equity swing trade recommendation from Finversify carries a defined entry price, stop-loss level, and target price before the alert reaches subscribers via WhatsApp and Telegram. The methodology targets a minimum reward-to-risk of 1:1.5 on any call, with most setups structured at 1:2 or higher, the general recommended floor for swing trading discussed throughout this article. Subscribers receive a rule-based call with the full position structure already worked out and the reasoning behind it shared transparently, rather than a vague prompt to ‘look at this stock.’
The rationale behind each call is shared with subscribers, which means every trade becomes a learning opportunity. Over time, subscribers start to recognise the setups, understand the stop placement logic, and apply the same framework independently. That is a fundamentally different value proposition from a service that simply sends a stock name and a target.
What SEBI registration means for traders who have been burned by tips
Finversify’s SEBI registration (INH 200008608) places it within a regulated framework that requires transparency, documented rationale, and defined risk disclosures, providing meaningful regulatory oversight and accountability that unregistered tip providers are not subject to. Unregistered services share recommendations without documented reasoning or regulatory obligation. The research rationale behind every Finversify call means you understand why a trade is being taken, which builds genuine competence over time rather than dependency on a signal service.
For traders who have previously followed unregistered services and ended up worse off, this distinction is meaningful. Regulation does not guarantee profits, but it does mean the service operates within a framework designed to protect the subscriber’s interests.
Putting the three pillars to work
All three elements, ratio, stop placement, and position sizing, are interdependent and must function as a single system. A minimum 1:2 reward-to-risk ratio sets the edge requirement. A stop-loss placed below structure and validated against ATR ensures the stop reflects actual market conditions. Position sizing at 1% of capital per trade limits the damage any single loss can do. None of these elements works in isolation. A strong ratio is useless if the stop is placed too tight and gets hit repeatedly by normal price noise. Sound stop placement is ineffective if position sizing means a single loss is too large to recover from.
The mathematics of swing trading is not complicated. Answering the question of what is a good reward to risk ratio for swing trades comes down to this: a 1:2 ratio with a 40% win rate produces a positive-expectancy system; a 1:3 ratio with even a 30% win rate produces a strong one. What separates traders who consistently apply this from those who do not is not intelligence, it is the discipline to check the numbers on every trade, skip the ones that do not qualify, and hold the process through losing streaks without abandoning it.
For practitioners managing a full-time career alongside an active trading account, Finversify’s equity swing calls apply this framework on every setup before the alert is sent. Every month, 8 to 10 research-backed NSE swing trades arrive with entry, stop, target, and rationale already defined. Explore the free Telegram channel to see the approach in action before committing to a subscription.
Frequently asked questions
What is a good reward to risk ratio for swing trades?
A 1:2 ratio is the practical minimum for swing trading, it requires only a 33.3% win rate to break even, leaving room for transaction costs and normal losing streaks. A 1:3 ratio is the preferred target, requiring just a 25% win rate to remain profitable. Ratios below 1:2 compress your margin so tightly that realistic transaction costs on Indian exchanges can push expectancy negative before you have placed a single trade.
How do I calculate the expected value of a swing trade?
Use the formula: EV = (Win Rate × Average Win) − (Loss Rate × Average Loss). A positive result confirms a mathematical edge over a large sample of trades. For a practical check, multiply your expected EV in R-multiples by your fixed risk amount (e.g. ₹5,000 at 1% of a ₹5,00,000 account) to see the rupee value of each trade’s expectancy.
How do I size positions correctly for swing trades?
Risk no more than 1% of total trading capital per swing trade. Divide that rupee risk amount by the distance in rupees between your entry and stop-loss to arrive at maximum share quantity. This keeps individual losses proportionate to your account size and ensures even a run of ten consecutive losses remains survivable rather than account-threatening.