
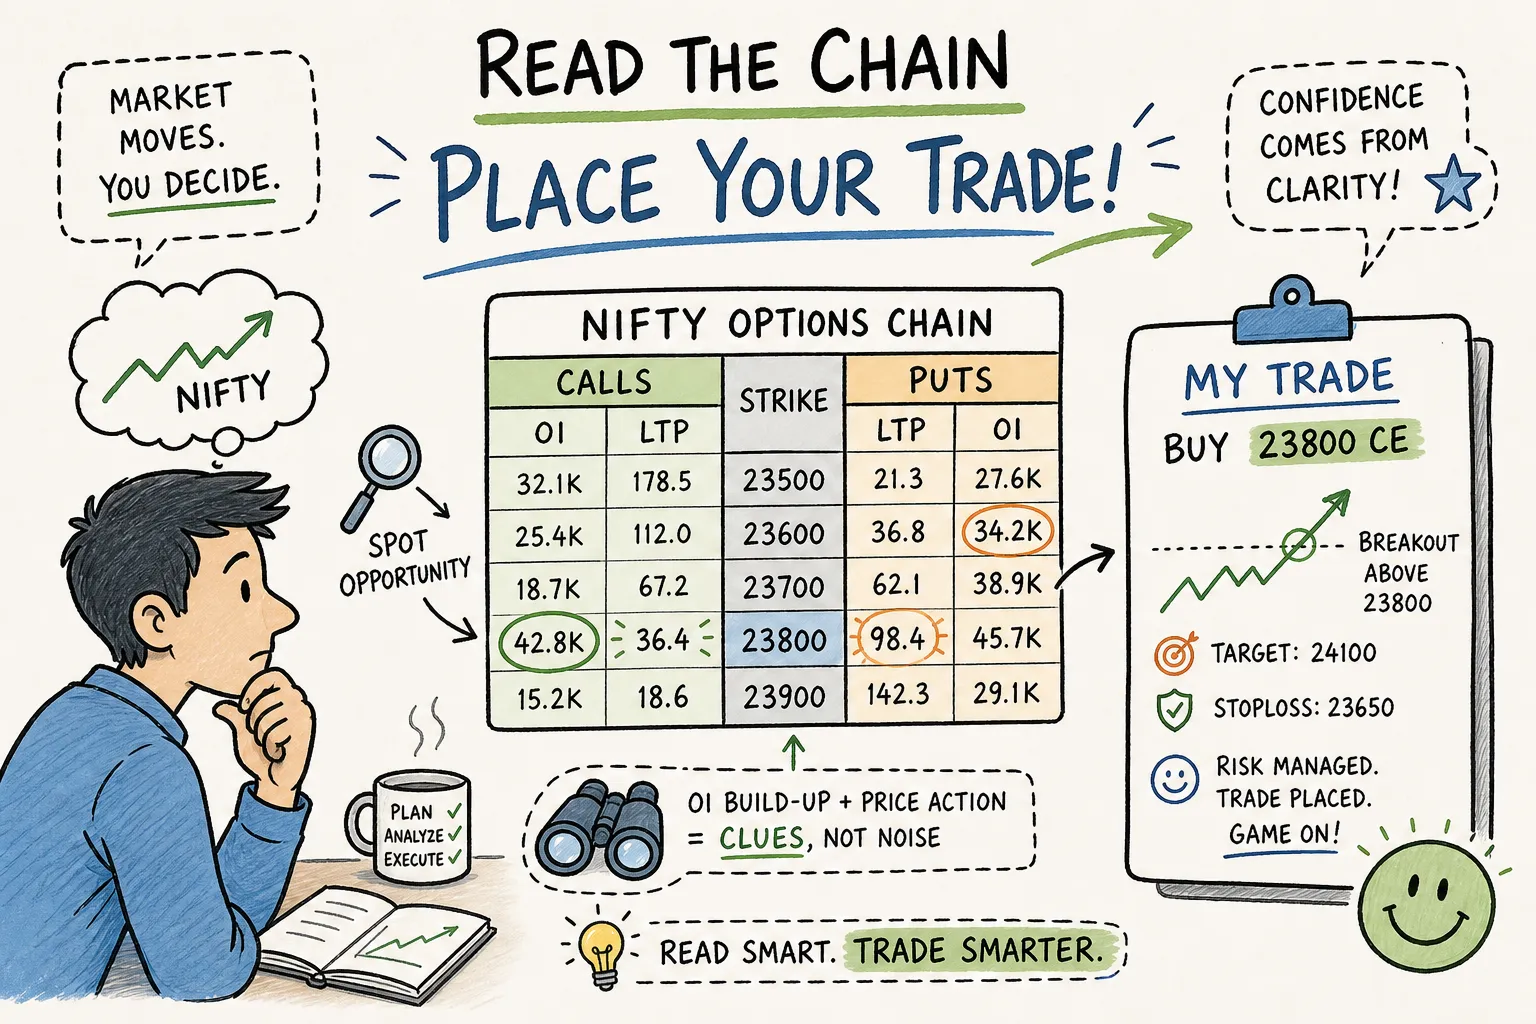
Open the NSE option chain for the first time and you will see dozens of columns, hundreds of strike prices, and numbers that seem to shift without logic. For anyone new to Nifty options trading, the screen can feel genuinely overwhelming, most beginners either freeze or, worse, place a trade without understanding what they are looking at. That is precisely where money quietly disappears, not because the market is unfair, but because the trader skipped the foundational reading.
This guide changes that. You will get a plain-language breakdown of how Nifty options work, what the option chain is actually communicating, how to choose a strike for a real setup, and the risk rules that prevent a first trade from becoming a costly lesson. At Finversify, every options call issued to subscribers comes with the exact chain reading behind it, not just a strike and expiry, but the full reasoning. This guide is built on that same approach.
What every beginner must know about Nifty option contracts
Many beginners lose money not because markets are complex, but because they skip the contract basics entirely. Before reading a single column on the chain, you need to understand what you are actually buying.
Lot size, tick value, and contract size
One Nifty options contract covers 65 units of the Nifty 50 index, following the lot size revision NSE applied from January 2026. This means a ₹1 move in premium equals ₹65 in profit or loss per contract. That changes the maths on “cheap” options considerably: a ₹5 OTM option is not a ₹5 trade, it is a ₹325 trade minimum, and any premium loss is multiplied by that same 65. Understanding lot size is the first step in sizing a position honestly.
Weekly vs monthly expiry: what changes for the trader
Nifty now has weekly contracts expiring every Tuesday and monthly contracts expiring on the last Tuesday of each month. Weekly contracts are popular with retail traders because of lower premiums and faster resolution. The trade-off is direct: weeklies decay faster, which benefits sellers but punishes buyers who are not quick to act on a view. Monthly contracts give a trade more time to play out but cost more premium upfront and carry higher Vega exposure around events.
Calls and puts: the two-sided bet
A Call option is a bet that Nifty will rise above the chosen strike before expiry. A Put option is a bet that Nifty will fall below the chosen strike. Many beginners start as buyers, which limits the maximum loss to the premium paid. Option selling carries materially different risk, and in some scenarios, substantially greater risk, than buying. Get comfortable on the buyer’s side first before considering the seller’s perspective.
Nifty options trading: how to read every column in the option chain
The option chain is structured with the strike price in the centre, calls on the left, and puts on the right. Each row represents a different strike. The columns tell you whether a strike is worth trading before you even look at a chart.
LTP, volume, and bid-ask: the liquidity signals
LTP is the Last Traded Price, the most recent premium at which that contract changed hands. Volume shows how many contracts traded during the session. Together, these two columns tell you whether a strike is actively traded or dangerously illiquid. A strike with low volume and a wide gap between the buy and sell price is a poor entry: you pay an inflated price to open the position and accept a discounted price when exiting, compressing any gain before the market even moves against you. Always check volume before selecting a strike, not just the premium level.
Open interest and OI change: the positioning map
Open Interest is the total number of outstanding contracts at a given strike that have not yet been settled. OI change shows whether that number grew or shrank compared to the previous session. Rising OI means fresh positions are being added; falling OI means they are being closed. High OI at a particular strike signals that a large number of participants have committed capital there, which often makes those strikes behave as price barriers during the session.
Implied volatility across strikes: what the chain is pricing in
IV is the market’s forward estimate of how much Nifty is likely to swing over the life of the option. Higher IV means options across the board are expensive. Before entering a trade, compare IV at your chosen strike against its recent historical average. If IV is unusually elevated, option buyers are paying a premium for uncertainty that may not materialise, the premium can deflate even if Nifty moves in the right direction.
Using OI and price together to read market direction
Once you have noted the IV context, the next layer is understanding how OI and price movement interact. The OI number alone is not a signal. The combination of OI direction and price movement is what gives you an actionable read on the market before the open and during the session.
Call wall and put wall: how to identify the range
The strike with the heaviest call OI above spot is commonly called the call wall. It acts as resistance because call writers profit if Nifty stays below it, giving them an incentive to defend that level. The strike with the heaviest put OI below spot is the put wall, acting as support for the same reason. Identifying these two levels before a session gives you a practical range within which to frame your trade.
The four OI-price combinations every trader should know
Reading OI change alongside price movement gives you four distinct signals that experienced traders use to assess conviction behind a move:
- Price rising with OI rising, fresh long buildup is entering the market, a genuinely bullish signal.
- Price falling with OI rising, fresh short positions are being added, confirming bearish pressure.
- Price rising with OI falling, this reflects short covering rather than fresh buying; the move lacks conviction.
- Price falling with OI falling, long unwinding, where existing bulls are simply exiting rather than fresh bears pressing in.
When a heavy OI level gives way
A high-OI strike is not an unbreakable wall. If Nifty approaches a heavy call OI level and that OI begins falling rather than rising, the resistance is weakening. This OI decay at a barrier is one of the most useful intraday signals on the chain: it suggests the writers are closing their positions, removing the cap, and making a breakout considerably more probable.
The three Greeks that matter most for Nifty weekly options
Greek letters intimidate beginners, but for practical Nifty options trading you only need three. You do not need the maths behind them; you need to understand what each one does to your position in real time.
Delta: your directional exposure per Nifty point
Delta tells you how much the option premium moves for every one-point move in Nifty. An ATM option carries a Delta of roughly 0.5, meaning the premium moves approximately 50 paise for every ₹1 Nifty moves. Higher Delta means a stronger link to the index’s direction. For directional trades, ATM or slightly ITM options give you the cleanest and most responsive exposure to the move you are anticipating.
Theta: why time is always working against the buyer
Theta measures daily premium decay. For weekly Nifty options, Theta accelerates sharply as Tuesday expiry approaches. This decay is particularly pronounced over weekends, when calendar days pass but the market does not trade, a weekly option held into Friday close can lose a meaningful portion of its remaining premium by Monday open, even if Nifty gaps nowhere. This is not a reason to avoid buying options; it is a reason to have a time-bound thesis and a pre-defined exit plan. Holding a weekly option without a clear trigger is simply paying Theta for nothing.
Vega: the event-day trap
Vega measures how much the premium changes with a one-point rise or fall in IV. Before major events like RBI policy announcements or Union Budget sessions, IV can spike sharply, inflating premiums across the chain. Once the event passes, IV collapses. The trap is this: even if Nifty moves in your direction after the event, the premium can fall because the IV premium you paid has been stripped away. Buying options just before a known event without factoring in Vega is one of the most consistent ways beginners lose on technically correct calls.
Nifty options trading: strike selection and risk rules before your first trade
Reading the chain correctly is half the job. Translating that reading into a specific, risk-controlled entry is the other half, and it is where most beginners short-circuit the process.
ATM vs OTM: which makes sense for your trade type
For intraday Nifty options, ATM or one strike ITM is the standard choice. These strikes respond most directly to same-day Nifty moves and are far less vulnerable to expiry-day decay than deep OTM contracts. Deep OTM options look attractive because of the low premium, a ₹5 OTM call seems like a small risk. But with the current lot size of 65, that is ₹325 per lot at entry, and the option needs a much larger Nifty move to generate returns. For swing trades held one to three days, ATM remains preferable because Theta compounds quickly on OTM positions held overnight.
Position sizing and the 30, 40% stop-loss rule
Never risk more than 1, 2% of total trading capital on a single options trade. In practice, if your trading capital is ₹2 lakh, one trade should risk no more than ₹2,000 to ₹4,000. A simple stop-loss rule that works well for option buyers: exit the position if the premium falls 30, 40% from your entry price. This protects against the slow, demoralising bleed that eliminates most option buyers over time. A fast loss is recoverable; a slow one that you hold through hoping it comes back rarely is.
Where to access live chain data
NSE’s own website provides the most authoritative free option chain data and is the best source for verification before any trade. Sensibull adds strategy tools and live Greeks on top of NSE data, making it useful for analysis and payoff modelling. Broker platforms like Zerodha, Upstox, and Angel One display chain data directly within the trading interface for faster execution. Refresh rates vary across platforms: some update every second, others every one to five minutes. Always verify you are looking at live data, not cached figures, before acting on a chain reading.
Why beginners get better results with guided calls than going it alone
Understanding the option chain is a genuine skill. Applying it correctly under live market conditions, under the pressure of an open position, is a different matter entirely. Most beginner losses in Nifty options trading do not happen because the trader is unintelligent. They happen because the trader acts without a verified thesis, without defined exit rules, and without disciplined position sizing.
What a research-backed advisory call actually looks like
At Finversify, a SEBI-registered investment advisory, every options call delivered via the premium WhatsApp and Telegram groups is designed to include the exact strike, expiry, entry range, target, and stop-loss, along with the chain reading and market logic behind the selection. A subscriber does not just receive a signal. They see which OI pattern supports the trade, what the IV context is, and what would invalidate the thesis. That combination of execution and explanation is how genuine learning happens alongside real trades.
Trading with structure while still learning
Some traders find that placing guided live trades with defined risk parameters accelerates experiential learning compared with paper trading, though it is worth noting that real capital is always at risk. Over time, watching how a professional reads the chain before issuing a call builds the pattern recognition that eventually makes a trader independent. The goal is never dependency; it is structured learning with real stakes that sharpen decision-making in a way simulations rarely can.
The difference between a tip service and a learning framework
A tip service sends you a strike. An advisory explains a trade. Finversify’s approach shares the rationale, the reward-to-risk context, and the post-trade analysis, which means subscribers are building a trading framework rather than outsourcing decisions indefinitely. That distinction matters considerably for long-term growth as a trader, chain-reading skills developed through guided exposure compound over time, just as poorly understood positions compound losses.
The chain tells the story: now you can read it
The Nifty option chain is not noise. It is a structured map of where institutional and retail participants are positioned, at what strikes, and with what conviction. Once you know how to read OI, IV, the four price-OI combinations, and the three key Greeks, the screen stops being intimidating and starts being informative.
The practical action items are straightforward: check the call wall and put wall before a trade, choose ATM over deep OTM, respect Theta on weekly positions held into expiry, and never risk more than 1, 2% per trade. These are not complicated rules; they are the difference between surviving long enough to get good and blowing up capital before the learning curve pays off.
With these principles in place, your journey in Nifty options trading becomes structured and repeatable rather than reactive and expensive. If you want to put them to work on real trades immediately, with research-backed entry, exit, and stop-loss levels on every call, explore Finversify’s advisory plans at Finversify.com. The free Telegram channel is a practical starting point: observe how chain data is applied to live calls before deciding whether a subscription fits your approach.
One Comment
[…] Reading an option chain and making high-probability trade decisions are two very different skills, and the gap between them is where most beginners lose money. Finversify bridges that gap with momentum-driven Nifty options picks that come with clearly defined entry levels, stop-losses and targets, so you learn by doing rather than by guessing. Every call includes the research rationale: which strikes are showing OI buildup, what IV conditions look like, and why a particular entry makes sense at that point in the expiry cycle. Over time, this builds genuine understanding of the chain rather than dependency on signals. […]