The outlook on the Nifty 50 Index stands very straight with no BS. It is Bullish.
The RSI – Momentum
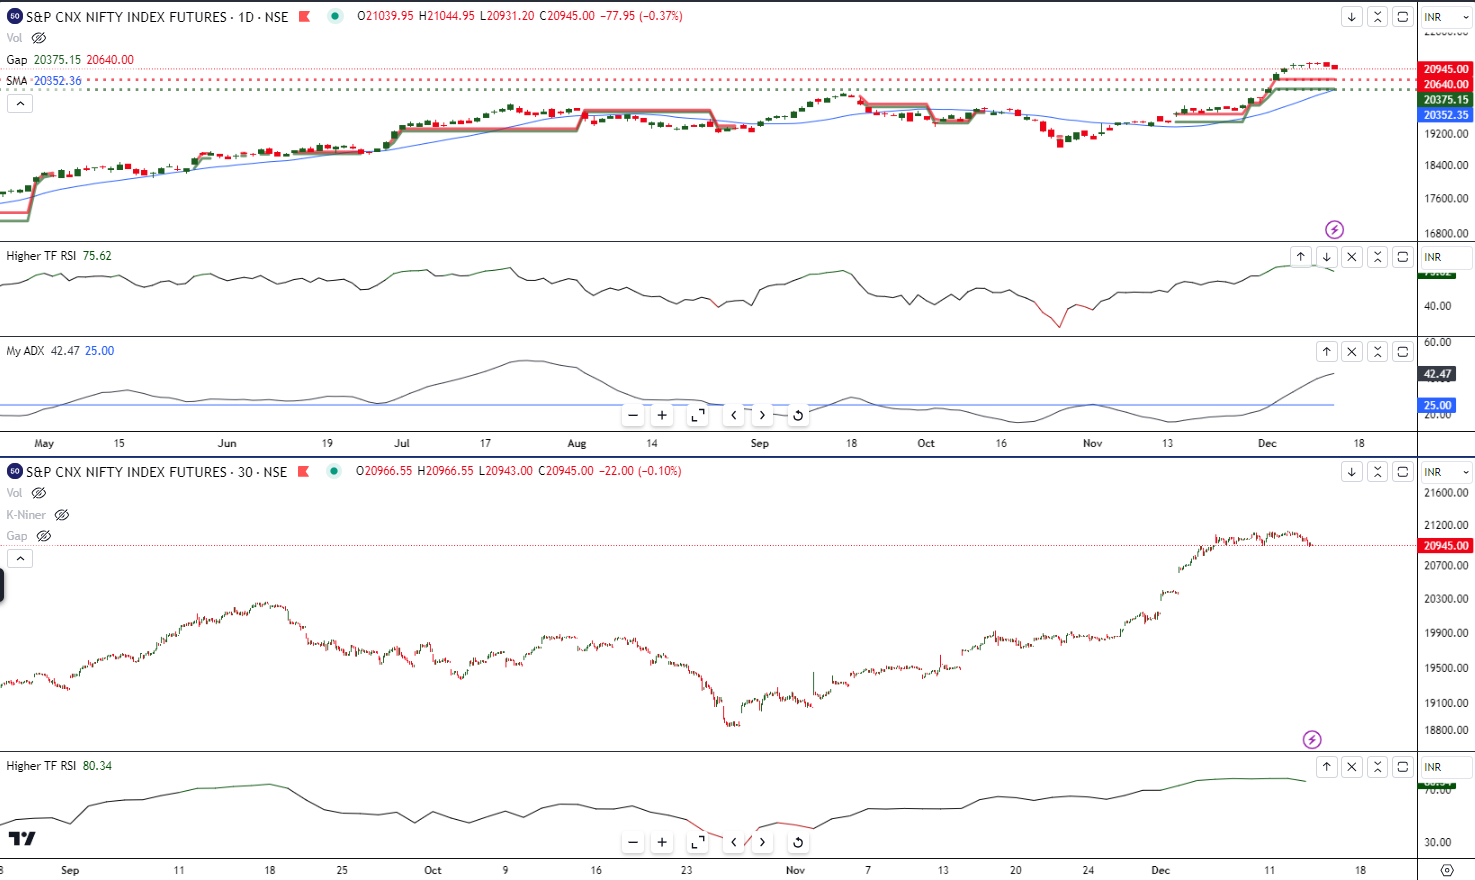
On the Daily timeframe, RSI is above the 80 mark. No, it’s not overbought; it indicates a thrust in the price action on the upside based on its recent AVG gains, which outweighed the average losses. Also, RSI can remain elevated above 70 for a sustained amount of time in a Bullish run.
The ADX – Trend Strength
The 14-Day ADX, A trend strength indicator, continues to rise on a rolling basis on a daily basis, indicating strength in direction and, at the same time, on a lower timeframe, forming a trough below 25 and reversing on the upside.
The 20D Moving Average – Trend
The continuous rise in 20-Day MA is positive, coming at 20352. Still, at the same time, the distance between MA and Price is stretched, indicating the current upward bias may consolidate, stall, dance or do whatever it would, but the trend is positive.
Support/Resistance and view.
Use the Supports at 20640 – 20375 to ride the trend and Stay Bullish. (Cause no one ever got rich by predicting the top)
On the last note, Christmas is approaching, and we will go in a festive mood, leaving our beloved market with lower liquidity and pale price action. But there is a Quote – “Never Short a Dull Market”!


