
Market Overview Indian equity markets extended their winning streak on Tuesday, closing higher for the second consecutive session amid improving investor sentiment and stability in global cues. The Nifty 50 advanced 121 points to settle at 25,695, while the Bank Nifty climbed 261 points to close at 58,138. The day witnessed healthy buying across Banking, IT, and Pharma counters, while FMCG and Auto saw selective profit booking. Broader markets outperformed benchmarks — the Nifty Midcap 100 gained 0.72% and the Smallcap 100 rose 0.61%, highlighting renewed strength in the broader universe. Setup 1 — Nifty 50: Key Resistance & Support Levels Nifty Close: 25,695 Market View: The Nifty 50 formed a bullish candle with a long upper shadow on the daily charts, showing sustained buying interest at lower zones. The index now trades above all major moving averages, signaling an improving structure. The RSI (56.07) indicates strengthening momentum, while the Stochastic RSI maintained a positive crossover, confirming a shift in bias toward bulls. The MACD continues to stay below its reference line, but fading negative momentum suggests early signs of recovery. Outlook: Sustaining above 25,700 could push the index toward 25,850–26,000. On the downside, 25,450 remains key short-term support. Setup 2 — Bank Nifty: Key Resistance & Support Levels Bank Nifty Close: 58,138 Market View: The Bank Nifty extended gains for the third consecutive session, forming a bullish candle with a long lower shadow — a sign of buying from lower levels. Momentum indicators reflect growing strength: RSI improved to 62.95, while Stochastic RSI maintained a bullish crossover. The MACD still trades below the signal line, but fading weakness in the histogram confirms improving market tone. Outlook: Bank Nifty remains bullish with a potential upside towards 58,700–59,000, while support holds near 57,400. Setup 3 — Nifty Options Data Call Option Data (CE): Put Option Data (PE): Interpretation:Nifty’s option data suggests a tight trading band between 25,500–26,000, indicating consolidation before a possible breakout. Setup 4 — Bank Nifty Options Data Call Option Data (CE): Put Option Data (PE): Interpretation:Bank Nifty’s option activity reflects bullish bias with 58,000 acting as a firm base and potential resistance near 58,600. Setup 5 — Sectoral Overview Sector Sentiment Commentary Banking & Financials Bullish Strong buying seen; momentum improving across private banks. IT Positive FII buying supports the uptrend; select midcaps outperform. Pharma Positive Defensive strength continues amid global uncertainty. FMCG Neutral Range-bound after mild profit booking. Metals Bullish Global commodity strength supports renewed buying interest. Setup 6 — India VIX The India VIX, which gauges near-term market volatility, fell slightly to 11.82, maintaining calm conditions.As long as the volatility index stays below the 13–14 zone, markets are likely to remain stable with a bullish undertone. Setup 7 — Strategy for the Day by Dhwani Patel Key Takeaways Index Bias Bullish Above Bearish Below Range Nifty 50 Positive 25,700 25,450 25,450–25,900 Bank Nifty Bullish 58,000 57,400 57,400–58,800 Dhwani Patel’s Market Insight “Momentum is gradually shifting back to the bulls as markets reclaim key averages. Traders should focus on breakout confirmation over anticipation and ride the trend with disciplined stop-loss placement.” Disclosure & Disclaimer: Dhwani Patel (SEBI Registration No: INH200008608) is a SEBI-registered Research Analyst. This report is intended for educational and informational purposes only and should not be construed as investment advice. Trading and investing in securities involve market risks; always consult a certified financial advisor before taking any investment decisions.
Trade Setup for 11 November 2025 by Dhwani Patel
Market Overview After staging a sustainable rebound from the crucial trendline support near 25,300 levels on Friday, the Nifty 50 extended its upmove on Monday amid volatility and ended higher by 82 points at 25,574. The index snapped its three-session losing streak. The market opened on a positive note and advanced further in early trade but encountered mild resistance near 25,650 levels before slipping into a late-session decline.Overall, the index traded in a narrow band between 25,500 and 25,650 throughout the day. Among top performers, Infosys, Bajaj Finance, and HCL Tech led the gains, while Trent, Max Healthcare, and Tata Consumer faced selling pressure.The broader market outperformed, with the Nifty Midcap 100 gaining 0.47% and the Nifty Smallcap 100 rising 0.35%. Sectoral performance was mixed, as IT, Pharma, and Metal indices closed in the green, while FMCG, Realty, and Media witnessed declines.Renewed foreign inflows also supported the market sentiment, with FIIs buying shares worth ₹4,581 crore and DIIs adding ₹6,675 crore in equities. Market Outlook The market continues to show resilience after defending the crucial 25,300 support zone, indicating strength in the broader trend. However, the index faces stiff resistance near 25,650–25,700, where selling pressure has been evident. A breakout above 25,700 could take the Nifty toward 26,000, while dips around 25,400–25,300 are expected to attract buying interest. The broader market structure remains constructive, and a breakout above 25,650 could trigger an upward move toward 25,800.A move above 25,600 will be crucial to confirm a directional uptrend; until then, the index may continue its sideways consolidation. The Nifty 50 appears to be in a consolidation phase, with the 50-day EMA near 25,338 acting as a strong support and resistance placed at 25,680–25,803. Setup 1 — Nifty 50: Key Resistance & Support Levels Nifty Close: 25,574 Market View: The Nifty 50 formed a bullish candle with a long lower shadow on the daily charts, indicating buying interest at lower levels despite mild pressure near the upper zone.The RSI has recovered to 52, while the MACD is flattening out near the neutral line — hinting at stabilising momentum. Outlook: Sustaining above 25,700 could push the index toward 25,900–26,000, while holding 25,400 will be crucial for maintaining bullish momentum. Setup 2 — Bank Nifty: Key Resistance & Support Levels Bank Nifty Close: 57,900 Market View: The Bank Nifty rebounded after two weak sessions, forming a bullish candle on the daily chart. The index is trading above its 20-day EMA and is likely to stay range-bound before a clear breakout. The RSI has moved up to 62.7, showing positive bias, though a move above 58,200 is essential for sustained strength. Outlook: A decisive close above 58,200 could lead to a rally toward 58,700–59,000, while support lies near 57,400–57,300. Setup 3 — Sectoral Overview Sector Sentiment Commentary IT Positive Backed by strong buying momentum and renewed global cues. Pharma Positive Outperformance continues amid defensive rotation. FMCG Neutral Mild profit booking seen post recent rallies. Metals Mildly Positive Benefiting from rebound in global commodity prices. Banking & Financials Neutral to Positive Range-bound trade, likely breakout above 58,200. Setup 4 — India VIX The India VIX, which measures market volatility, slipped 0.74% to 11.78, reflecting lower volatility and stable sentiment.A sustained reading below the 13–14 zone supports a bullish environment for the near term. Setup 5 — Strategy for the Day by Dhwani Patel Key Takeaways Index Bias Bullish Above Bearish Below Range Nifty 50 Positive 25,700 25,400 25,400–25,900 Bank Nifty Neutral to Positive 58,200 57,400 57,400–58,700 Dhwani Patel’s Market Insight “The market is slowly stabilising after recent volatility. A sustained move above resistance levels could spark fresh momentum in key sectors. Traders should stay selective, focus on volume confirmation, and avoid aggressive shorts unless Nifty closes below 25,400.” Disclosure & Disclaimer: Dhwani Patel (SEBI Registration No: INH200008608) is a SEBI-registered Research Analyst. This report is intended solely for educational and informational purposes and should not be considered as investment advice. Trading and investing in securities involve financial risk; investors should consult their financial advisors before taking positions.
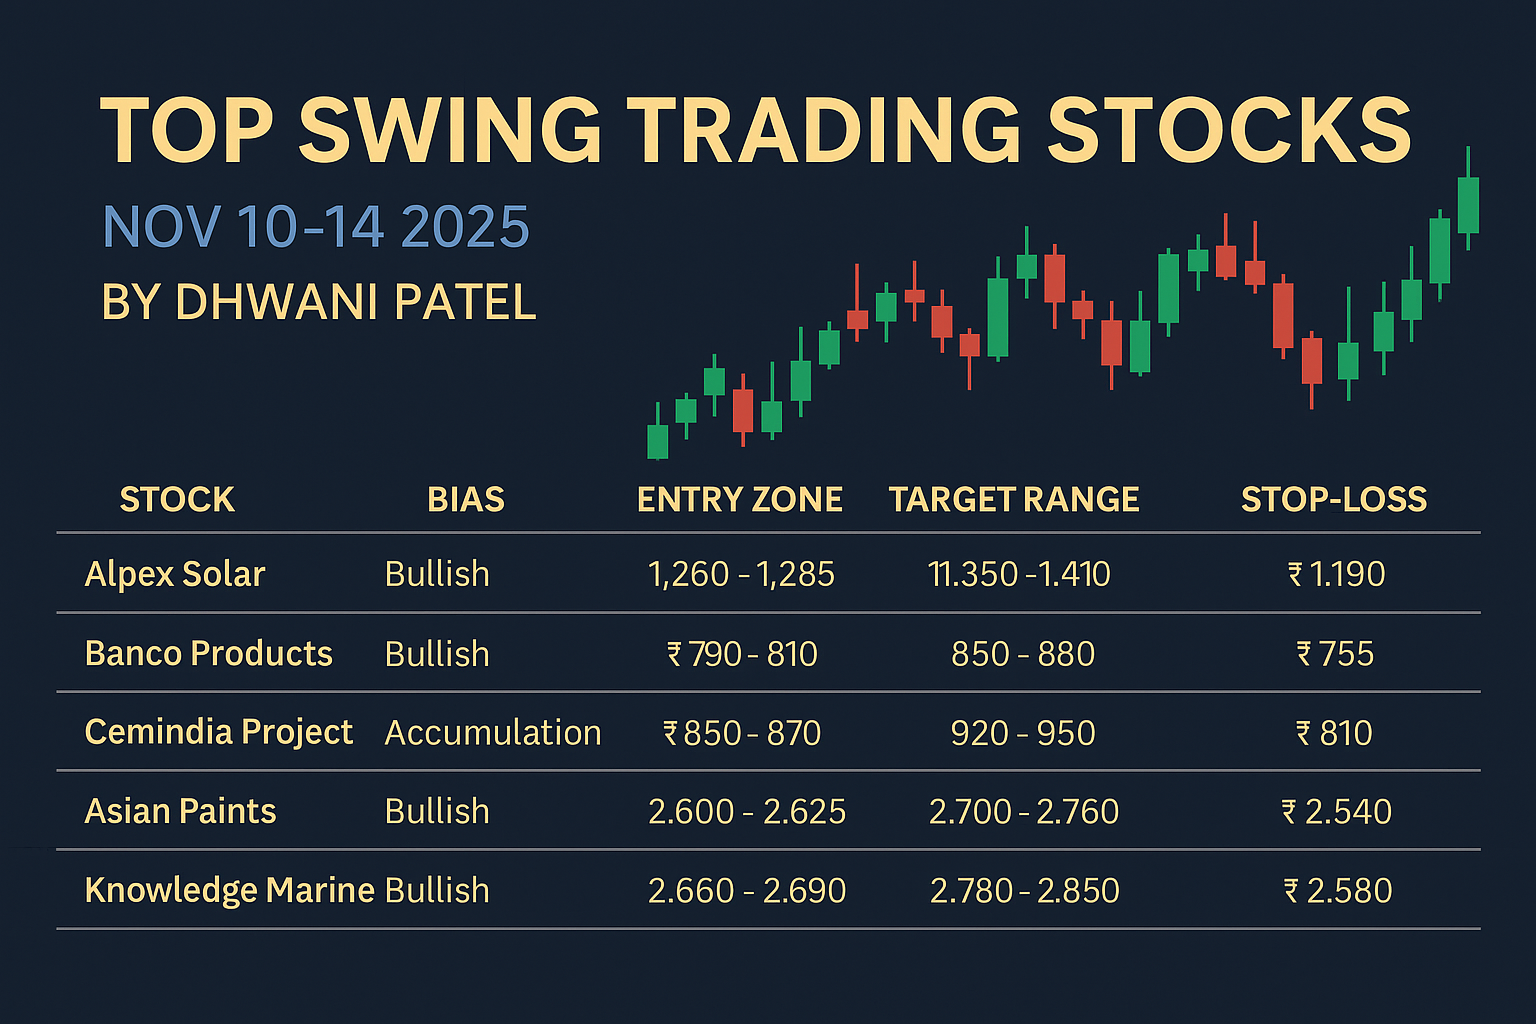
Top Swing Trading Stocks for This Week (Nov 10–14, 2025) | Short-Term Trading Ideas by Dhwani Patel
Market Outlook After a volatile start to November, Indian equities are hovering near critical support zones. The Nifty 50 has been consolidating below 25,600, and momentum indicators hint at short-term range-bound action.This environment is ideal for swing traders, where selective stock-specific strength offers high-probability opportunities. Below are five top swing trading stocks chosen for the week based on price action, volume surge, RSI, MACD, and short-term momentum. 1. Alpex Solar Ltd (CMP ₹ 1,280) Setup: A strong uptrend continues after a brief consolidation. Price has retested its breakout zone near ₹1,250 and bounced sharply on rising volume. 2. Banco Products India Ltd (CMP ₹ 798) Setup: The stock has broken a short-term falling channel and now trades above its 20- and 50-day EMAs. 3. Cemindia Project Ltd (CMP ₹ 856) Setup: Price has been consolidating for 10 days and is now showing an upward breakout with 9% rise in ROCE. 4. Asian Paints Ltd (CMP ₹ 2,613) Setup: After multiple tests near ₹ 2,570 support, the stock has formed a bullish hammer pattern. 5. Knowledge Marine & Engineering Works (CMP ₹ 2,678) Setup: Recently completed a flag pattern breakout above ₹ 2,600 with healthy volumes. Bonus Watchlist Stocks Strategy for the Week Dhwani Patel’s Swing Trading Insights “Discipline is the edge in swing trading — a clear plan, tight risk control, and objective exit levels define success. Traders should focus on stocks with consistent volume confirmation and breakout patterns.” Key Takeaways Stock Bias Entry Zone Target Range Stop-Loss Alpex Solar Bullish Continuation ₹ 1,260–1,285 ₹ 1,350–1,410 ₹ 1,190 Banco Products Bullish Reversal ₹ 790–810 ₹ 850–880 ₹ 755 Cemindia Project Accumulation Breakout ₹ 850–870 ₹ 920–950 ₹ 810 Asian Paints Bullish Rebound ₹ 2,600–2,625 ₹ 2,700–2,760 ₹ 2,540 Knowledge Marine Bullish Continuation ₹ 2,660–2,690 ₹ 2,780–2,850 ₹ 2,580 Disclosure & Disclaimer: Dhwani Patel (SEBI Registration No: INH200008608) is a SEBI-registered Research Analyst.The information above is for educational and informational purposes only and does not constitute investment advice.Trading in securities involves risk of loss; consult your financial advisor before acting on any recommendation.
Trade Setup for 10 November 2025 by Dhwani Patel
Market Overview Indian markets ended the previous session on a mixed note, with volatility continuing to dominate investor sentiment. The Nifty 50 managed to hold key support levels and formed a bullish candle after three consecutive sessions of weakness, suggesting that buyers are gradually returning near lower zones. Despite this rebound, broader market participation remained limited as traders awaited fresh triggers amid global uncertainty. The Bank Nifty, however, outperformed the benchmark index, helping markets stabilize ahead of the new week. According to Dhwani Patel, the overall structure remains neutral-to-cautious, with Nifty yet to reclaim short-term moving averages. Sustained movement above resistance zones may revive momentum, while failure to do so could keep the market in a consolidation phase. Setup 1 — Nifty 50: Key Resistance & Support Levels Nifty Close: 25,492 Resistance (Pivot Points): 25,543 / 25,598 / 25,687Support (Pivot Points): 25,365 / 25,310 / 25,221 Market View The Nifty 50 formed a bullish candle with a long lower shadow and a minor upper shadow, reflecting strong buying at lower levels despite intermittent selling pressure. The index continues to trade below short-term moving averages and the midline of the Bollinger Band, but remains above medium- and long-term averages, indicating that the broader trend is still intact. Momentum indicators show cautious sentiment — the RSI stands at 49.16, and the MACD remains below the reference line, with the histogram further weakening.All of this suggests a bearish-to-neutral momentum, where follow-through buying above 25,600 could trigger a short-term reversal. Interpretation: Dhwani Patel observes that as long as Nifty holds above 25,350, intraday dips may attract buying. A decisive close above 25,600 would be the first sign of recovery. Setup 2 — Bank Nifty: Key Resistance & Support Levels Bank Nifty Close: 57,877 Resistance (Pivot Points): 58,001 / 58,200 / 58,522Support (Pivot Points): 57,356 / 57,157 / 56,835 Resistance (Fibonacci Retracement): 58,735 / 60,142Support (Fibonacci Retracement): 57,394 / 56,662 Market View The Bank Nifty led the recovery, gaining 323 points and forming a bullish candle with upper and lower shadows — signaling renewed buying interest and intraday volatility. The index climbed back above short-term moving averages and the midline of the Bollinger Band, hinting at improving momentum.The RSI moved higher to 60.03, though it still holds a bearish crossover, while the MACD remained below its reference line, reflecting cautious optimism. Interpretation: Dhwani Patel suggests that traders should closely monitor the 58,000 mark. A strong close above it could trigger follow-up buying, while a fall below 57,300 would weaken sentiment again. Setup 3 — Nifty Options Data Interpretation: The options data indicates a sideways trading range for Nifty between 25,350–25,700, with positional resistance around 25,700. Setup 4 — Bank Nifty Options Data Interpretation: Bank Nifty options suggest a range-bound move between 57,300–58,500, with bullish bias emerging above 58,000. Setup 5 — Sectoral Trends Dhwani Patel notes that sectoral rotation continues, and traders should focus on financials and autos for intraday opportunities. Setup 6 — India VIX The India VIX dipped 1.5% to 12.12, suggesting lower volatility and improved market confidence.A sustained move below 12 may continue to support a short-term recovery. Setup 7 — Intraday Outlook Index Bullish Above Bearish Below Range Nifty 50 25,600 25,350 25,350–25,700 Bank Nifty 58,000 57,300 57,300–58,500 Strategy by Dhwani Patel Setup 8 — Finversify Market Insight The Trade Setup for 10 November 2025 indicates a cautious recovery following a weak week.With Nifty stabilizing near support and Bank Nifty showing resilience, traders can expect range-bound movement with bullish undertones if buying continues above key short-term averages. However, sustained rejection near resistance levels may keep the market volatile and prevent a breakout in the short term. Key Takeaways Disclosure & Disclaimer: DHWANI PATEL (SEBI Registration No: INH200008608) is a SEBI Registered Research Analyst. The report is for informational and educational purposes only and does not constitute investment advice. Trading and investing involve risk; consult a qualified advisor before taking positions.
Trade Setup for 7 November 2025 by Dhwani Patel
Market Overview Indian equities extended their losing streak on Thursday, as persistent selling pressure and weak global cues weighed heavily on investor sentiment. The Nifty 50 slipped below the 25,500 mark, continuing its pattern of lower highs and lower lows for the second straight session. After a subdued start, the index attempted a brief recovery but failed to hold onto early gains, ending 87 points lower at 25,509. The broader market remained under pressure, with Nifty Midcap 100 falling 0.95% and Nifty Smallcap 100 down 1.40%, underperforming the benchmark indices. Among sectoral performers, Nifty IT and Auto managed to post marginal gains, while Media, Metal, and Consumer Durables dragged the market lower.Top gainers included Asian Paints, Reliance Industries, and UltraTech Cement, whereas Grasim, Hindalco, and Adani Enterprises emerged as the key laggards. Meanwhile, fintech player Pine Labs is set to launch its ₹3,900-crore IPO on Friday, with a price band of ₹210–221 per share, valuing the firm at over ₹25,300 crore. Setup 1 — Nifty 50: Key Resistance & Support Levels Nifty Close: 25,509 Resistance (Pivot Points): 25,700 / 25,800 / 25,880Support (Pivot Points): 25,450 / 25,400 / 25,350 Market View The Nifty 50 continued its downtrend, forming a lower high–lower low structure for the second consecutive day. The index has now entered a crucial support zone between 25,400–25,450, which aligns with its previous trendline resistance. Although the overall bias remains negative, holding above this support area could provide some near-term relief. On the upside, any rebound will likely face resistance around 25,700–25,800, beyond which a short-term trend reversal may emerge. Momentum indicators remain weak, with the RSI drifting near the 50 mark, suggesting fading strength. The MACD continues to signal a bearish crossover, reflecting sustained selling pressure. Interpretation: Dhwani Patel notes that Nifty’s inability to hold above 25,500 indicates fragile sentiment. A decisive close below 25,400 may accelerate the downside, while holding above could trigger a mild recovery toward 25,750. Setup 2 — Bank Nifty: Key Resistance & Support Levels Bank Nifty Close: 57,776 Resistance (Pivot Points): 57,900 / 58,000 / 58,100Support (Pivot Points): 57,400 / 57,300 / 56,800 Market View The Bank Nifty index extended its decline for the second straight session, consolidating near its previous swing support. The index continues to hover around its 20-day EMA zone (57,400–57,300), which is expected to act as an immediate cushion. A breakdown below 57,300 could drag the index toward 56,800, while any sustained rebound will face resistance near 57,900–58,000. The RSI has slipped below 60, and the MACD is nearing a bearish crossover, both indicating a weakening short-term trend. Interpretation: Dhwani Patel suggests that traders should watch for a decisive move below 57,300 for fresh short opportunities, while a recovery above 58,000 could signal temporary stabilization. Setup 3 — Nifty Options Data Interpretation:Option data suggests a range-bound scenario between 25,400–25,800, with strong resistance near 25,800 and support around 25,400. Setup 4 — Bank Nifty Options Data Interpretation:Option positions indicate a restricted trading range for Bank Nifty between 57,000–58,000, with bias slightly tilted toward the downside. Setup 5 — Sectoral Trends Dhwani Patel emphasizes that sector rotation is likely to continue, with defensive stocks providing stability in an otherwise weak market environment. Setup 6 — India VIX The India VIX edged slightly higher to 12.35, up 1.2% from the previous session, reflecting mild volatility.However, the fear gauge remains below the 13–14 zone, suggesting that despite recent corrections, market sentiment remains under control. Setup 7 — Intraday Outlook Index Bullish Above Bearish Below Range Nifty 50 25,750 25,400 25,400–25,800 Bank Nifty 57,900 57,300 57,300–58,000 Strategy by Dhwani Patel Setup 8 — Finversify Market Insight The Trade Setup for 7 November 2025 reflects a neutral-to-cautious stance, with the market continuing to consolidate near key supports.While the broader trend remains intact, traders should remain vigilant as short-term indicators signal pressure at higher levels. A decisive move above 25,800 (Nifty) or 58,000 (Bank Nifty) could reignite bullish momentum; failure to sustain these levels may invite further profit booking. Key Takeaways Disclosure & Disclaimer: Dhwani Patel (SEBI Registration No: INH200008608) is a SEBI Registered Research Analyst. This report is intended solely for educational and informational purposes and should not be considered as investment advice. All trading and investment decisions involve risk.
Trade Setup for 6 November 2025 by Dhwani Patel
The Indian equity market extended its losing streak as major indices closed in the red on November 5, mirroring weak global cues and continued profit booking across sectors. The Nifty 50 slipped further below its short-term averages, while Bank Nifty formed a pattern hinting at short-term consolidation with a bearish bias. Analyst Dhwani Patel notes that although the broader structure remains positive, the short-term setup suggests caution amid fading momentum. Traders are advised to stay selective and focus on key support levels for directional clarity. 1) Key Levels for the Nifty 50 (25,598) Resistance based on pivot points: 25,734 / 25,784 / 25,863Support based on pivot points: 25,575 / 25,525 / 25,445 Technical View:The Nifty 50 formed a long bearish candle on the daily charts, confirming continuation of the lower high–lower low pattern with above-average volumes. The index slipped below its 10-day and 20-day EMAs, signaling short-term weakness, though it continues to trade above the 50-day and 100-day EMAs, indicating that the medium-term trend is still intact. Momentum indicators turned cautious — the RSI dropped to 52.76 with a clear bearish crossover, while the MACD turned negative as its histogram slipped below the zero line.These signals together indicate a weak short-term trend, suggesting that the index could remain under pressure unless it reclaims the 25,780–25,860 resistance zone. 2) Key Levels for the Bank Nifty (57,827) Resistance based on pivot points: 58,041 / 58,132 / 58,280Support based on pivot points: 57,745 / 57,654 / 57,506 Resistance based on Fibonacci retracement: 58,735 / 60,142Support based on Fibonacci retracement: 57,394 / 56,662 Technical View:The Bank Nifty formed a bearish candle with upper and lower shadows within the previous day’s range — a sign of indecision or inside bar formation. Although the index remains above its short- and medium-term moving averages, the momentum appears to be fading. The RSI fell to 60.75 and continued its negative crossover, while the MACD also turned bearish, and its histogram moved below the zero line.This setup reflects a short-term downtrend with the possibility of continued weakness if 57,745 support is breached. 3) Broader Market Overview After several sessions of volatility, traders are finding limited directional movement. Dhwani Patel suggests traders keep a close watch on the Nifty support zone at 25,525 and Bank Nifty near 57,500, as holding above these levels could trigger a short-term recovery bounce. 4) Technical Summary Index Trend Key Support Key Resistance RSI MACD Outlook Nifty 50 Bearish 25,525 25,863 52.76 Negative Weak, caution advised Bank Nifty Bearish 57,506 58,280 60.75 Negative Short-term pressure 5) Analyst View – Dhwani Patel “Both Nifty and Bank Nifty have entered a short-term consolidation phase. The broader trend remains intact, but the momentum indicators reflect near-term weakness. Traders should adopt a sell-on-rise approach while maintaining strict stop losses below crucial support zones,”says Dhwani Patel, SEBI Registered Research Analyst at Finversify. 6) Market Sentiment Check 7) Trading Strategy for the Day Stock-Specific Focus:Buying interest may continue in defensive sectors like Pharma, IT, and FMCG, while Financials and Metals could stay range-bound. 8) Market Outlook As the market approaches the weekend, sentiment is likely to remain cautious. Consolidation may persist before any strong breakout occurs.For now, a range-bound movement between 25,500–25,850 for Nifty and 57,400–58,300 for Bank Nifty is expected. 9) Nifty & Bank Nifty Options Data Nifty Options (Monthly Data) Bank Nifty Options (Monthly Data) Interpretation:The option data suggests a range-bound market with 25,500–25,850 for Nifty and 57,000–58,200 for Bank Nifty. Breakouts beyond these levels could determine fresh directional moves. 10) India VIX Update The India VIX, also known as the volatility index, edged higher to 12.21 — up 0.9% from the previous session.While volatility has increased slightly, it remains below the 13–14 caution zone, implying that the broader trend still favors bulls despite short-term pullbacks. Traders should, however, remain watchful of any sharp uptick in VIX, which could trigger intraday swings and rapid position adjustments in the derivatives market. Conclusion As markets approach the weekend, consolidation may continue amid weak global cues.While the medium-term structure remains bullish, the immediate outlook is neutral to negative, with pressure likely until Nifty reclaims 25,800–25,850 and Bank Nifty crosses 58,200 decisively. Disclaimer: This analysis is for educational and informational purposes only. The views expressed by Dhwani Patel are based on technical indicators and market data as of November 6, 2025.It should not be considered as investment advice. Please consult your financial advisor before making trading or investment decisions.

Gold Rate Today – November 3, 2025: Latest 22K & 24K Gold Prices in India
Gold Rates (10g) Loading live rates… 24K ₹ Pure Gold 22K ₹ Standard 18K ₹ Jewelry 14K ₹ Light Alloy ↻ Refresh Rates Gold continues to hold a strong position as one of India’s most valued and trusted investment options. From jewellery and coins to bars and art, the love for gold among Indian households remains unmatched. Despite consistent fluctuations in global prices, gold’s reputation as a safe-haven asset keeps investors attracted. On November 3, 2025, gold prices in India registered a slight rise, reflecting stability in international markets and steady demand in domestic markets. Current Gold Prices (as of November 3, 2025) Type 1 Gram 10 Grams 100 Grams Price Change (from Nov 2) 22 Carat Gold ₹11,340 ₹1,13,400 ₹11,34,000 +₹150 24 Carat Gold (Pure) ₹11,907 ₹1,19,070 ₹11,90,700 +₹160 Gold Price Movement: The price increase aligns with a moderate rise in global spot gold rates and minor weakness in the U.S. dollar. 22 Carat vs 24 Carat Gold: What’s the Difference? Before buying gold, it’s important to understand the difference between the two most common forms: Gold Rate Today in Major Indian Cities (as of November 3, 2025) City 22K Gold (1 Gram) 24K Gold (1 Gram) Delhi ₹11,390 ₹11,960 Mumbai ₹11,340 ₹11,907 Chennai ₹11,350 ₹11,918 Hyderabad ₹11,350 ₹11,918 Bangalore ₹11,400 ₹11,970 Jaipur ₹11,394 ₹11,964 Kolkata ₹11,440 ₹12,012 Pune ₹11,340 ₹11,907 Ahmedabad ₹11,394 ₹11,964 Lucknow ₹11,390 ₹11,960 Highlights: Gold Price Trend – Last 10 Days Date 22K Gold (10 gm) 24K Gold (10 gm) Nov 03, 2025 ₹1,13,400 ₹1,19,070 Nov 02, 2025 ₹1,13,250 ₹1,18,910 Nov 01, 2025 ₹1,13,250 ₹1,18,910 Oct 31, 2025 ₹1,12,950 ₹1,18,600 Oct 30, 2025 ₹1,10,950 ₹1,16,500 Oct 29, 2025 ₹1,11,950 ₹1,17,550 Oct 28, 2025 ₹1,13,000 ₹1,18,650 Oct 27, 2025 ₹1,14,650 ₹1,20,380 Oct 26, 2025 ₹1,15,700 ₹1,21,490 Oct 25, 2025 ₹1,15,700 ₹1,21,490 Gold has shown a steady upward movement over the past 10 days, influenced by festive season buying and higher international demand. Key Factors Influencing Gold Prices in India Gold prices are determined by a combination of global and domestic factors. Here are the main drivers: Tips Before Investing in Gold If you’re planning to buy or invest in gold, here are a few points to keep in mind: Outlook for Gold Prices With inflationary pressures and global uncertainty, analysts expect gold to remain a preferred safe-haven asset in the near term. Prices may see gradual upward movement through the festive and wedding season, supported by retail demand and global cues. Disclaimer This article is for informational purposes only. The prices mentioned are subject to change based on market fluctuations. Always verify current gold rates before buying or investing.
Trade Setup for 4 November 2025 by Dhwani Patel
Market Overview After a brief pullback in the previous session, Indian equities are expected to begin November 4, 2025, on a mixed note. The markets are currently navigating through a consolidation phase, characterized by volatility and profit booking at higher levels. While Nifty 50 and Bank Nifty managed to hold above their crucial support zones, sentiment remains slightly cautious due to soft global cues and limited follow-through buying. In this analysis, Dhwani Patel, SEBI Registered Research Analyst, breaks down the key levels, momentum indicators, and derivatives data to provide a clear view of the market landscape for the day. Setup 1 — Nifty 50: Key Resistance & Support Levels Nifty Close: 25,763 Market View:The Nifty 50 formed a bullish candle with both upper and lower shadows on the daily charts, indicating intraday volatility but a positive bias. However, the index continued to follow a lower high–lower low pattern for the third straight session since hitting the 26,100 mark. It now trades below its 10-day EMA, yet comfortably above the 20- and 50-day EMAs, showing that the medium-term trend remains stable. The index is also hovering around the midline of its Bollinger Bands, implying consolidation rather than a trend reversal. Momentum indicators present a mixed picture. The RSI, at 58.99, has maintained a bearish crossover, hinting at fading strength, while the MACD is on the verge of turning negative as its histogram flattens near the zero line. Interpretation: Dhwani Patel notes that traders following nifty futures trading guides should maintain a sideways to cautious stance, focusing on short-term opportunities rather than directional bets. Setup 2 — Bank Nifty: Key Resistance & Support Levels Bank Nifty Close: 58,101 Market View:The Bank Nifty displayed resilience by forming a bullish candle that remained within the previous day’s range, supported by above-average volumes. This pattern suggests buyers are still active near lower levels, keeping the undertone positive. The index continues to hold above all key moving averages, reaffirming its longer-term strength. However, short-term indicators are flashing caution — the RSI (65.60) has turned slightly upward but remains in a negative crossover, while the MACD has now entered a bearish crossover zone, with its histogram dipping below zero. Interpretation: Dhwani Patel emphasizes that traders using index futures trading strategies in India should stay selective and manage positions tightly. Setup 3 — Nifty Options Data On the Put side, Interpretation:Nifty options data indicate a tight range between 25,600–26,000, implying consolidation with limited directional bias. Setup 4 — Bank Nifty Options Data On the Put side, Interpretation:The 58,000–58,500 zone remains critical for the Bank Nifty. Sustaining above 58,200 could revive momentum, while failure to hold above 57,800 may trigger another round of selling. Setup 5 — Sectoral Trends Dhwani Patel suggests that equity swing trading strategies in India should focus on defensive sectors or stocks showing relative strength. Setup 6 — India VIX India VIX: 12.04 (down 0.9%) Volatility cooled slightly after two days of rise, indicating a mild return of trader confidence. The fear gauge remains well below the 13–14 zone, suggesting the market is not expecting extreme turbulence. Setup 7 — Intraday Outlook Index Bullish Above Bearish Below Range Nifty 50 25,835 25,640 25,700–25,850 Bank Nifty 58,225 57,695 57,800–58,200 Strategy by DHWANI PATEL: Setup 8 — DHWANI PATEL’s Market Insight “Markets are like pendulums — they swing between optimism and caution. True traders read the rhythm, not the noise.” — Dhwani Patel The Trade Setup for 4 November 2025 reflects a neutral-to-cautious stance, as the market digests recent gains. While the broader trend remains positive, momentum indicators call for short-term prudence. A decisive move above key resistance levels could revive bullish momentum, while failure to hold near supports might extend the consolidation phase. Key Takeaways SEBI-Compliant Disclaimer Disclosure & Disclaimer: Dhwani Patel (SEBI Registration No. INH200008608) is a SEBI registered research analyst. This report is intended for informational purposes only and should not be construed as investment advice. All trading and investment decisions involve risk.

Swing Trading Stocks This Week (Nov 3-7 2025)
Swing Trading Stocks This Week (Nov 3-7, 2025) As we enter the week of November 3 to 7, 2025, swing traders should adopt a focused, tactical approach. With broader market consolidation taking place, opportunities are emerging in stocks showing strong volume, clear chart structure and sector‐leadership. At the same time, volatility remains elevated — making risk management and discipline more important than ever. In this article, we’ll cover: 1. Market Context & Sector Themes The Indian equity market continues to exhibit a mix of resilience and caution. After multi-week rallies, momentum is pausing for consolidation. For swing traders, this means: 2. Criteria for Stock Selection For this week’s swing ideas we applied the following filters: 3. Top Stock Picks for Nov 3-7, 2025 a) Stock A – Hindalco Industries b) Stock B – Cholamandalam Investment c) Stock C – Shriram Finance d) Stock D – Cummins India e) Stock E – Indian Bank f) Additional Picks: 4. Trade Parameters & Setup 5. Risk Management & Trader Psychology 6. Final Word The week of Nov 3-7, 2025 offers a fertile ground for well-picked swing trades. With momentum rotating across sectors and volume breakouts emerging, traders who combine discipline, risk control and technical clarity can aim for meaningful short-term gains. As always, stick to your criteria: liquidity, momentum verification, clear chart structure, and defined risk. The picks above reflect current market realities and momentum signals — monitor them actively, adapt to unfolding news, and align with your trading style. Disclosure & Disclaimer: Dhwani Patel (SEBI Registration No. INH200008608) is a SEBI registered research analyst. This report is for educational and informational purposes only and should not be interpreted as investment or trading advice. Market participation carries risk; always consult a financial professional before making trading decisions.
Trade Setup for 3 November 2025 by Dhwani Patel
Introduction After a week of steady strength, Indian markets showed clear signs of fatigue on November 1, with both Nifty 50 and Bank Nifty retreating as sellers emerged at higher levels. Profit booking intensified in select heavyweights, while broader market participation thinned out ahead of the new month. In this Trade Setup for 3 November 2025, Dhwani Patel, SEBI registered research analyst, breaks down the Nifty and Bank Nifty levels, key derivatives data, and momentum signals to help traders navigate this near-term consolidation phase effectively. Setup 1 — Nifty 50: Key Resistance & Support Levels Nifty Close: 25,722 Market Outlook:The Nifty 50 formed a long bearish candle with an upper shadow on the daily charts — an indication of selling pressure at higher levels. The index broke below its 10-day EMA, marking a loss of short-term momentum, though it remains comfortably above the 20-, 50-, and 100-day EMAs, maintaining its medium-term uptrend. The index also fell below the 23.6% Fibonacci retracement level of its October rally, signaling a potential shift toward a corrective phase. The RSI dropped to 57.84, and the Stochastic RSI confirmed a bearish crossover, suggesting waning strength. The MACD is on the verge of a negative crossover, with its histogram flattening near the zero line — often a precursor to mild weakness. Interpretation: For followers of the Nifty futures trading guide, the bias remains cautious in the short term — traders should stay light and focus on quick trades with tight stop-losses. Setup 2 — Bank Nifty: Key Resistance & Support Levels Bank Nifty Close: 57,776 Market Outlook:The Bank Nifty formed a bearish candle for the second consecutive day, accompanied by above-average volumes — a clear indication that traders are booking profits near the higher range. The index also slipped below its 10-day EMA, signaling near-term weakness. However, it still trades comfortably above its 20-, 50-, and 100-day EMAs, suggesting that the larger trend remains positive. The RSI, at 62.29, and the Stochastic RSI both exhibited bearish crossovers, while the MACD histogram continued to decline, though the overall signal line remains positive. These patterns collectively suggest temporary weakness while the broader bias stays upward. Interpretation: For index futures trading strategies India, it’s best to maintain a sell-on-rise approach until momentum indicators show signs of recovery. Setup 3 — Nifty Call Options Data Interpretation:Call writers are building strong resistance at 25,900–26,100, which may cap upside attempts in the near term. The bias is gradually tilting toward consolidation within a broader range. Setup 4 — Nifty Put Options Data Interpretation:Put writers have shifted their base lower from 25,800 to 25,600, reflecting cautious sentiment. Traders seem to be hedging against potential dips in the short term. Setup 5 — Bank Nifty Call Options Data Interpretation:Heavy Call writing around 58,000–58,500 reflects trader caution. A sustained move below 57,700 could add more pressure, while a breakout above 58,500 is needed to restore bullish momentum. Setup 6 — Bank Nifty Put Options Data Interpretation:Support remains visible around 57,500, but if this level breaks, the index may slip toward 57,000–56,600 quickly. Setup 7 — India VIX (Volatility Index) India VIX: 12.14 (+1.5%) Volatility rose for the second consecutive session, reflecting growing nervousness among traders. The fear gauge remains below the 13–14 risk zone, but continued up-moves in VIX could tighten risk-reward conditions for long positions. As Dhwani Patel puts it,“Markets lose patience faster than momentum — and that’s when discipline matters most.” Setup 8 — Sectoral Trends For swing trading strategies India, this rotation suggests traders should shift focus to low-beta or defensive sectors until trend clarity returns. Setup 9 — Intraday Playbook Index Bullish Above Bearish Below Neutral Zone Nifty 50 25,888 25,646 25,700–25,850 Bank Nifty 58,124 57,526 57,700–58,000 Strategy: Setup 10 — Dhwani Patel’s View “Momentum is fading, but the structure remains healthy. Markets often test conviction before rewarding patience.” The Trade Setup for 3 November 2025 indicates short-term caution, with both indices under pressure. However, broader moving averages remain supportive, suggesting that corrections could be limited if key supports hold. Key Takeaways Final Thoughts The market is transitioning from a phase of momentum to a phase of consolidation. Such setups are opportunities for tactical traders but demand strict discipline and position management. As Dhwani Patel often emphasizes — “Bull markets rest — they don’t vanish. The smart money doesn’t panic; it prepares.” Disclosure & Disclaimer: Dhwani Patel (SEBI Registration No. INH200008608) is a SEBI registered research analyst. This report is for educational and informational purposes only and should not be interpreted as investment or trading advice. Market participation carries risk; always consult a financial professional before making trading decisions.