

Introduction — why a robust crude oil trading strategy matters now Crude oil remains one of the most liquid and news-sensitive markets in the world. Over the past few weeks (Oct 2025) prices have been range-bound near the low-$60s for Brent and high-$50s for WTI, pressured by demand worries and a possible supply surplus into 2026, even as geopolitical events create episodic volatility. Having a clearly defined crude oil trading strategy—one that blends macro awareness with precise technical rules—lets traders profit from short-term swings while protecting capital against sudden shocks. This guide (authored with actionable notes from Dhwani Patel) walks you through up-to-date trade plans, intraday and swing setups, options tactics, position-sizing, and example trades you can adapt for MCX (India) or global crude futures. Current market snapshot (Oct 2025) — what’s moving prices Before trading, understand the near-term drivers: Takeaway: the market has a neutral-to-slightly-bearish bias on the macro calendar but remains tradeable intraday and for multi-day swings when you align with news and structure. Trading approaches — choose the right frame for your temperament We’ll cover practical rules for each and provide examples using current market context. Core rules for any crude oil trading strategy Intraday crude oil trading strategy (practical rules) Time window: focus on U.S. session overlap (approx 6:30 pm – 11:30 pm IST) for the highest intraday liquidity. Indicators: VWAP (day), 20 EMA (5-min), RSI (14), 1-minute/5-minute candles. Setup A — VWAP break + volume confirmation (momentum trade) Setup B — VWAP fade (mean reversion) Why this works now: Range-bound global crude and softened demand signals mean day-to-day directional moves are often mean-reverting unless confirmed by news. Trading around VWAP gives a statistical edge intraday. Recent market diagnostics also show low volatility pockets that make VWAP reversion setups reliable until a large external shock. Swing crude oil trading strategy (2–10 days) — trend-follow blueprint Timeframes: Daily chart for bias, 4-hour for entries, 1-hour for fine-tune. Indicators: 50-EMA (trend), 20-EMA (momentum), MACD (signal), RSI (confirmation), Fibonacci retracement for entries. Long setup (trend-follow): Short setup (trend-follow): the inverse: daily close below 50-EMA, wait for rally into 20-EMA / Fibonacci 38.2–50% and bearish MACD/RSI confirmation. Why this works now: With Brent and WTI trading in a stable range, swing traders can exploit pullbacks into EMAs and ride counter-rotations when a fundamental catalyst (e.g., inventory draw or supply disruption) forces continuation. OPEC commentary suggesting a smaller 2026 deficit means sharp moves will likely be catalyst-driven rather than persistent one-way trends — ideal for disciplined swing trading. Options strategies around oil events (defined risk) Options let you trade crude exposures with defined risk — especially useful around EIA and OPEC windows. 1. Straddle (high-volatility play) 2. Short Iron Condor (volatility sellers) 3. Debit spread (directional but cheaper) Practical note: Options on MCX (or global exchanges) carry different liquidity and skew. Check open interest and bid-ask spreads before placing options trades. In current Oct 2025 conditions, implied vol has receded from summer highs — so straddles cost somewhat less but still expensive ahead of major events. Example trades (live-context ideas you can adapt) All example prices are illustrative; check live prices before trading. Example 1 — Intraday VWAP momentum Example 2 — Swing trend entry after pullback Example 3 — Options straddle ahead of OPEC statement Note: Use these examples as templates. Dhwani Patel recommends verifying global inventory prints and setting alerts for any late-breaking geopolitical headlines before taking significant position sizes. Risk management — the non-negotiable part of any crude oil trading strategy Tools and data sources every crude trader should have Common pitfalls & how to avoid them How Dhwani Patel approaches crude oil trades (practical checklist) Dhwani Patel’s process condenses macro awareness with technical filters into a quick checklist before every trade: This approach helps keep trades consistent and reduces “quick judgement” errors. Building a repeatable trading plan (template) Final checklist before you trade crude today If all checks are green, proceed with your pre-defined position sizing. Conclusion — actionable edge for crude oil traders A robust crude oil trading strategy combines macro awareness (EIA reports, OPEC outlooks, geopolitical risk) with disciplined technical setups (VWAP, EMAs, MACD) and strict risk rules. Current Oct 2025 market conditions show range structure with episodic volatility — ideal for traders who blend intraday VWAP setups with swing entries on pullbacks and who respect event-driven risks. Use options when you want defined risk around major events. Keep the journal, measure outcomes, and iterate. If you’d like, I can convert these rules into a printable trading checklist, build a TradingView watchlist with annotated example charts, or draft a 1-page daily crude market brief you can push to your Telegram followers. — Dhwani Patel Disclosure & Disclaimer: dhwani patel (SEBI Registration No. INH200008608) is a SEBI registered research analyst. This article is for educational and informational purposes only and does not constitute investment advice or recommendations. Trading involves risk. Readers should conduct their own analysis before acting on any insights.

Swing Trading Stocks for This Week (Oct 20–25, 2025): 8 High-Probability Ideas & Trade Plans
Intro — Why swing trading this week? The Indian market has shown strong momentum heading into Diwali, with select large-caps leading a broad rally. That environment creates fast, tradable moves for swing traders — but also requires discipline (defined entries, stops and clear profit objectives). This article gives you a short, practical list of swing trade setups for the week of Oct 19–25, 2025, with technical entry zones, stop-losses, targets, and the catalyst that makes each idea actionable. Recent market momentum (led by top names such as Reliance and Airtel) suggests rotational flows into cyclicals and select midcaps — exactly the environment where swing trades can perform well. 6) Naukri / Info Edge (NAUKRI) — Momentum / IT-services adjacent swing Why: Featured among swing ideas due to relative strength and gap-fill setups on technical scans (also visible in community-sourced setups on TradingView). Platform play benefits if hiring / job trends stay resilient.Entry Zone: Buy on breakout above ₹4,250 or on dip to ₹4,000–4,080.Stop-Loss: ₹3,840.Target 1: ₹4,520 — Target 2: ₹4,800.Trade Notes: Keep exposure moderate; news around business metrics can swing price fast. 7) Suzlon Energy (SUZLON) — Higher risk swing (cyclical + news-driven) Why: Cited by some broker lists as a tactical buy for energy/capex turnarounds; high volatility, but large upside on re-rating or order wins. Use only as a small allocation swing.Entry Zone: Buy on confirmed support hold around ₹95–98 or on breakout above ₹105 with volume.Stop-Loss: ₹88.Target 1: ₹118 — Target 2: ₹135.Trade Notes: This is a higher-risk trade; consider intraday exits if momentum fades. 8) Select PSU / Dividend-yielding names (Coal India, Hindustan Zinc) — Conservative swing plays Why: These names often move with yield/commodity cycles but can offer stable short-term swings when commodity sentiment is positive. Use smaller targets with tight stops.Example Trade (Coal India): Entry ₹270–278, SL ₹258, Target ₹295 / ₹315.Example Trade (Hindustan Zinc): Entry ₹330–340, SL ₹315, Target ₹360 / ₹380.Trade Notes: Best for conservative swing players who want lower beta exposure. Trade management and exit rules Example position-sizing template (quick) Final checklist before you take a swing trade Closing thoughts Swing trading works best when you combine technical clarity (clean entry, confirmed volume) with catalyst awareness (broker interest, corporate events, sector rotation). This week’s market backdrop — festive-season flows and large-cap leadership — creates many short-term opportunities, but also raises the need for strict risk management. If you’d like, I can: Stay disciplined, and happy trading. Disclosure & Disclaimer: dhwani patel (SEBI Registration No. INH200008608) is a SEBI registered research analyst. This article is for educational and informational purposes only and does not constitute investment advice or recommendations. Trading involves risk. Readers should conduct their own analysis before acting on any insights.

Top Dividend Paying Stocks in India (2025): Best Picks for Steady Income
Introduction In a market that often rewards capital gains, many investors overlook a powerful source of returns: dividends. A dividend is a portion of a company’s profit paid to shareholders, and for many investors, it acts like passive income. If you are aiming for consistent income while holding quality stocks, dividend-paying companies become key candidates. This blog dives deep into the top dividend paying stocks in India (2025), how to pick them, and how you can build a balanced dividend-focused portfolio. Whether you are a long-term investor or seeking “coffee-money” from your holdings, this guide is for you. Why Dividend Stocks Matter However, not all dividend stocks are equal. A high dividend yield may look tempting but can be risky if not supported by strong fundamentals. Let’s look at how to evaluate them before jumping into the picks. How to Evaluate Dividend Paying Stocks Before selecting the top dividend stocks, here are critical metrics and qualitative checks: Metric / Check What to Look For Ideal Range / Condition Dividend Yield Dividend per share / current price Typically 3%–8% for large caps; very high yields (10%+) need deeper scrutiny Payout Ratio (%) of earnings paid as dividend Preferably < 60–70% (too high suggests unsustainability) Earnings Growth Ability to grow profits over time 5–15%+ annual growth is favorable Cash Flow Quality Strong operating cash flows Free cash flow should comfortably cover dividends Debt Levels Lower leverage is safer Debt/Equity ratio < 1 (or manageable for sector norms) Consistency & Track Record Stable dividend history Companies with 5–10+ years of dividend stability or growth Sector & Business Model Defensive or regulated sectors often fare better Utilities, power, oil & gas, infrastructure, telecom etc. Top Dividend Paying Stocks in India (2025 Picks) Here’s a curated set of high-dividend stocks in India, combining yield, stability, reputation, and future prospects. Company Approx Dividend Yield* Why It Stands Out Risks to Consider Coal India Ltd. ~6–8%+ Large PSU, cash rich, consistent dividend history ET Money+1 Commodity risk, regulatory & environmental pressures Vedanta Ltd. ~8–10% Diversified mining & metals business, potential for cyclical upside Tickertape+2smallcase+2 Volatility in commodity cycles, capital expenditure needs Hindustan Zinc Ltd. ~5–7% Part of Vedanta, strong balance sheet, lower volatility Metal prices, input costs, regulatory risk Castrol India Ltd. ~5–6% Niche in lubricants, steady demand, moderate payout Commodity risk, margin pressure from raw oils PTC India Ltd. ~6–7% In the power sector, steady cash flows Regulatory risk, currency & interest rates MSTC Ltd. ~7–8% Government-linked, consistent dividend yield record ET Money+1 Limited growth potential, niche business dependencies Gujarat Pipavav Port Ltd. ~5% Infrastructure play, steady usage Port traffic risk, regulatory & environmental hurdles Canara Bank High yield Some public sources show very high yields in banking ET Money Banking sector stress, NPAs, regulatory policy risk *Yields may fluctuate. Always cross-check latest data before investing. Let’s explore a few of these in more detail. Coal India Ltd. Why It’s Attractive: As one of India’s major coal producers with significant government backing, Coal India has shown solid ability to generate profits and distribute them. In recent times, it has offered yields that beat comparable fixed-income rates. Caution: Coal is sensitive to commodity cycles, regulatory changes, carbon pricing, and environmental pressures. Vedanta Ltd. Strengths: Vedanta’s diversified portfolio across mining, metals, oil & gas and its ability to generate cash enables dividend potential. It’s among names listed in high dividend stock lists by multiple platforms. Risks: Its profitability is linked to commodity cycles, and capex demands are high in mining sectors. Also, large investments and debt management must be watched closely. Hindustan Zinc Ltd. Operating under Vedanta, Hindustan Zinc has a relatively stable business, with lower volatility compared to mining for some metals. Its dividend payout has historically been reliable. Risks: Dependent on zinc, lead, silver prices, regulatory oversight, energy costs, and global demand trends. Castrol India Ltd. For those wanting exposure outside pure metals or mining, Castrol India offers exposure to lubricants. It tends to have steadier margins during cycles due to branding and distribution. Risks: Sensitivity to crude oil and base oil prices, competition from global players, margin pressure from raw cost swings. How to Build a Dividend Portfolio Risks & Caveats in Dividend Investing Case Study: HCL Tech — Dividend Consistency HCL Technologies recently announced its 91st consecutive quarterly dividend at ₹12 per share, emphasizing its focus on returning capital to shareholders. The Economic Times It’s not a high-yield stock, but the consistency showcases the kind of stable dividend philosophy ideal for portfolio builders. Actionable Steps for Investors Conclusion “Top dividend paying stocks in India” is not just a phrase — it’s a strategy for those seeking income plus capital gains. While the likes of Coal India, Vedanta, Hindustan Zinc, and Castrol India often feature in dividend lists, what distinguishes a great dividend stock is sustainability, growth, and strong fundamentals.
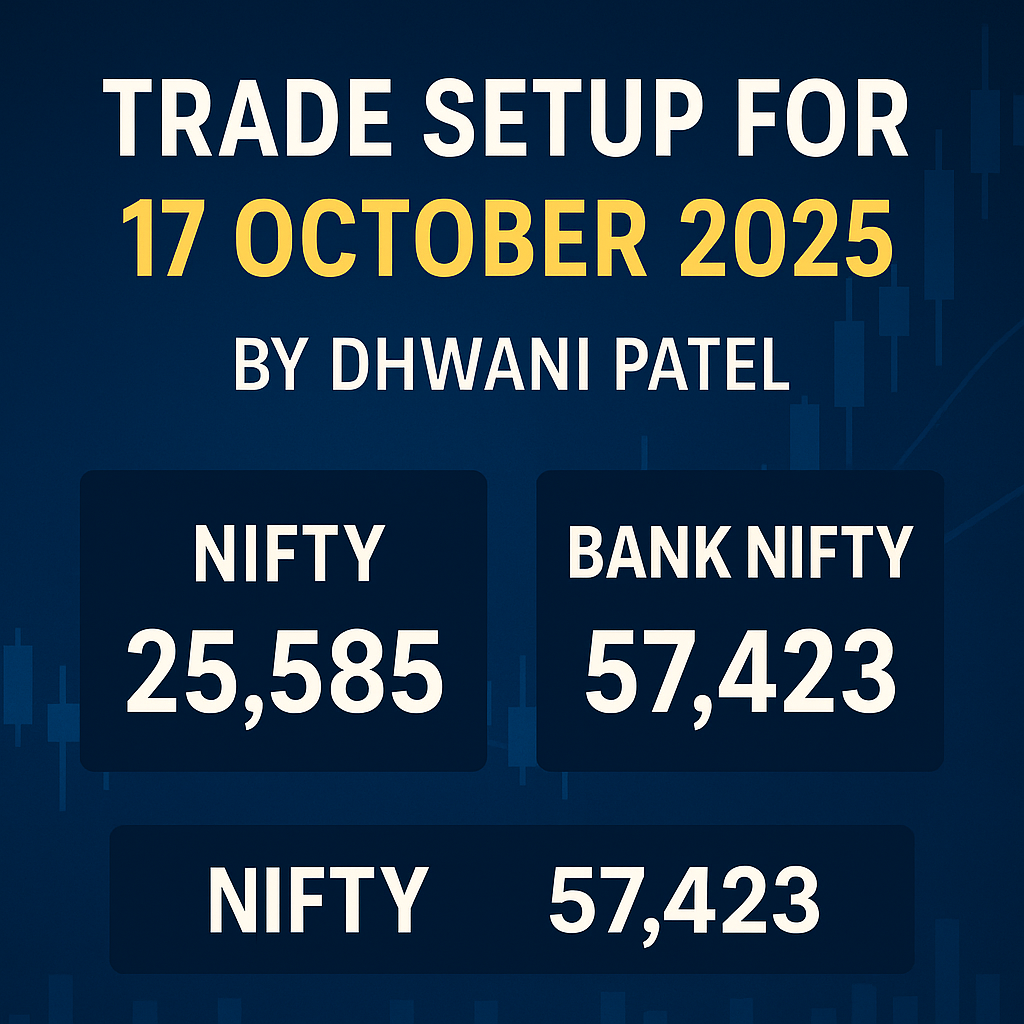
Trade Setup for 17 October 2025 by dhwani patel
Introduction Indian markets enter October 17, 2025, on a strong footing after back-to-back bullish sessions. A broad-based rally across sectors helped both Nifty 50 and Bank Nifty reclaim key resistance zones, turning them into short-term supports. In this Trade Setup for 17 October, dhwani patel, SEBI registered research analyst, breaks down the exact pivot and Fibonacci levels, recent technical formations, and 10 actionable setups for traders and investors preparing for Friday’s trade. ⚙️ Setup 1 — Nifty 50: Key Resistance & Support Levels Nifty Close: 25,585 Special Formation:The Nifty 50 formed a long bullish candle on the daily charts after a gap-up opening, moving decisively above its downward-sloping resistance trendline, which now acts as a new support zone. All key moving averages continue to trend upward, confirming trend alignment. The RSI has risen to 66.82, while the MACD sustains a bullish crossover with an expanding histogram — clear evidence of momentum strength. Interpretation: From a Nifty futures trading guide perspective, the structure remains bullish — traders can maintain a buy-on-dips approach while guarding profits near upper bands. ⚙️ Setup 2 — Bank Nifty: Pivot & Fibonacci Levels Bank Nifty Close: 57,423 Special Formation:The Bank Nifty formed a bullish candle with minor upper and lower shadows — signaling firm control by buyers despite mild volatility. The index is now just shy of its record high of 57,628, reflecting sustained upward momentum. It continues to form a higher high–higher low pattern, with the RSI elevated at 72.64 and MACD confirming a bullish structure.Key moving averages remain upward sloping, highlighting a strong technical setup. Interpretation: Banking stocks remain the primary driver of market strength — ideal for traders implementing index futures trading strategies India. ⚙️ Setup 3 — Option Chain Insights Nifty Call OI: 25,700, 25,800, 26,000Nifty Put OI: 25,400, 25,300, 25,200 Bank Nifty Call OI: 57,500, 58,000Bank Nifty Put OI: 57,000, 56,500 Interpretation:The concentration of puts around 25,300–25,400 and 57,000 highlights strong short-term support.Call writers remain cautious beyond 25,700 on Nifty and 57,500 on Bank Nifty.If price sustains above those strike levels, short-covering could add momentum into the weekend. ⚙️ Setup 4 — Market Sentiment & PCR The Put-Call Ratio (PCR) for Nifty stands near 1.15, reflecting moderate bullishness.Sentiment is constructive but not overstretched.If PCR jumps beyond 1.3, traders should watch for possible profit-booking near resistance zones. For now, market structure favors the bulls with steady volumes and broad participation. ⚙️ Setup 5 — Volatility View: India VIX India VIX remains subdued near 10.5 — a zone associated with calm trading conditions.However, with Nifty approaching fresh highs, complacency risk increases.A sudden VIX spike could bring intraday whipsaws — traders should tighten stop-losses and size positions accordingly. ⚙️ Setup 6 — Sectoral Trends For swing trading strategies India, rotating between strong sectors and staying aligned with trend direction offers higher reward potential. ⚙️ Setup 7 — Technical Snapshot Summary Index Candle Type Momentum RSI MACD Outlook Nifty 50 Long Bullish Strong 66.82 Bullish Crossover Positive Bank Nifty Bullish Very Strong 72.64 Bullish Crossover Highly Positive Reading:Both indices exhibit trend confirmation across price, momentum, and volume data — a trifecta of bullish strength. The only caution is RSI nearing overbought territory; traders should trail profits instead of initiating fresh large positions mid-zone. ⚙️ Setup 8 — Global Cues & FII-DII Data Global equity sentiment remains mildly positive. Together, this backdrop supports continued upside unless global volatility spikes unexpectedly. ⚙️ Setup 9 — Intraday Trade Plan Index Bullish Above Bearish Below Neutral Zone Nifty 50 25,624 25,376 25,400–25,600 Bank Nifty 57,517 56,986 57,000–57,400 Plan: Stay light on size during first-hour volatility; increase exposure only once direction confirms. ⚙️ Setup 10 — dhwani patel’s View “Momentum has matured but not exhausted. The structure favors continuation with higher supports now acting as launchpads. Keep positions aligned with the trend, not against it.” The Trade Setup for 17 October 2025 signals a continuation phase — bulls retain control, but traders should protect profits with discipline.Intraday volatility may increase near resistance; prepare for possible consolidation before the next leg up. ⚠️ Key Takeaways Final Thoughts The market momentum remains healthy, with both indices showing strong alignment between trend, volume, and momentum indicators.Traders can maintain a bullish bias but should stay alert to intraday fluctuations as indices approach higher resistance zones. As dhwani patel puts it — “Markets reward patience in trends and discipline in volatility. Know your levels, manage your risk, and let the trend work for you.” Disclosure & Disclaimer: dhwani patel (SEBI Registration No. INH200008608) is a SEBI registered research analyst. This article is for educational and informational purposes only and does not constitute investment advice or recommendations. Trading involves risk. Readers should conduct their own analysis before acting on any insights.

Trade Setup for 16 October 2025 by dhwani patel
Introduction The market enters October 16, 2025, with an optimistic tone as both Nifty 50 and Bank Nifty continue to trade above their key moving averages. The bullish momentum seen earlier this week seems to have extended further, supported by positive technical formations and improving market breadth. In this Trade Setup for 16 October, dhwani patel, SEBI registered research analyst, breaks down the exact pivot and Fibonacci levels, technical formations, and 10 structured setups to help traders navigate today’s session with clarity and control. ⚙️ Setup 1 — Nifty 50: Key Resistance & Support Levels Nifty Close: 25,324 Technical Outlook:The Nifty 50 formed a long bullish candle with small upper and lower shadows — a strong indicator of buyer dominance. The index now trades well above all key moving averages, with both short- and medium-term averages sloping upward. The RSI at 60.49 confirms strength, while the MACD maintains a bullish crossover with an expanding histogram. This combination supports a positive short-term outlook. Interpretation: For traders following a Nifty futures trading guide, the bias remains bullish with “buy-on-dips” setups favored until 25,155 holds. ⚙️ Setup 2 — Bank Nifty: Pivot & Fibonacci Levels Bank Nifty Close: 56,800 Technical Outlook:Bank Nifty rebounded strongly after a day of consolidation, forming a bullish candle that completed a 78.6% Fibonacci retracement from July’s record high to the September low. The index now sits comfortably above all major moving averages, signaling sustained strength. Both RSI and MACD show a positive bias, confirming momentum alignment with price structure. Interpretation: This pattern reflects the characteristics of a continuation phase — ideal for index futures trading strategies India built around trend-following logic. ⚙️ Setup 3 — Derivatives & Option Chain Data Nifty OI: Bank Nifty OI: Interpretation:The options setup suggests a mild bullish bias, with put writers active near 25,200 on Nifty and 56,500 on Bank Nifty. Unless these supports break, the market is likely to maintain higher lows. ⚙️ Setup 4 — Market Sentiment & PCR The Put-Call Ratio (PCR) for Nifty hovers near 1.05 — balanced but tilted bullish.An uptick beyond 1.2 may reflect overconfidence, while a dip below 0.9 could indicate hedging pressure. Sentiment currently leans positive, supported by steady FII participation and range-bound VIX levels. ⚙️ Setup 5 — Volatility Index (India VIX) India VIX remains subdued around 10.8, indicating stable risk appetite among traders.However, with indices nearing upper resistance, sudden spikes in volatility can’t be ruled out. “Low VIX gives confidence, but it’s also where traders often get complacent,”says dhwani patel.Use volatility compression as an opportunity for breakout setups, not comfort. ⚙️ Setup 6 — Sectoral Focus Strategy Tip: Rotate capital toward trending sectors — a core aspect of swing trading strategies India. ⚙️ Setup 7 — Technical Formations Recap Index Candle Type Trend Signal Indicators Outlook Nifty 50 Long bullish candle Sustained uptrend RSI > 60, MACD bullish Positive Bank Nifty Bullish candle, post-retracement Trend continuation RSI, MACD rising Positive Both indices reflect healthy internal structure, confirming that dips remain buyable until lower supports are violated. ⚙️ Setup 8 — Global & Macro Influences US and European markets closed mixed, while Asian peers opened stable. Crude prices stayed range-bound, and bond yields softened — both favorable for emerging markets. These cues should keep Indian indices supported, provided no external shock emerges mid-session. ⚙️ Setup 9 — Intraday Playbook Index Bullish Above Bearish Below Neutral Zone Nifty 50 25,361 25,155 25,200–25,300 Bank Nifty 57,004 56,472 56,600–56,900 Trading Plan: Risk discipline remains your edge; overconfidence is your enemy. ⚙️ Setup 10 — dhwani patel’s View “Momentum remains aligned with trend. The chart structure is strong, and data supports continuation. But traders should protect profits and trail stops — markets reward preparation, not prediction.” With both Nifty and Bank Nifty sustaining above key averages, the setup favors a steady upward bias with selective opportunities in large-cap banks and midcaps. ⚠️ Key Takeaways Final Thoughts The Trade Setup for 16 October 2025 signals confidence with caution — the market trend remains intact, but traders must stay agile. As dhwani patel reminds every morning — “Your discipline decides your returns. The market only gives you what you deserve.” Disclosure & Disclaimer: dhwani patel (SEBI Registration No. INH200008608) is a SEBI registered research analyst. This content is for educational purposes only and should not be construed as investment advice or a buy/sell recommendation. Markets are volatile; always conduct independent analysis.
Trade Setup for 15 October 2025 by dhwani patel
Introduction Every trading session begins with an invisible tug-of-war between buyers and sellers. For October 15, 2025, the Nifty and Bank Nifty levels published in pre-market commentary will serve as reference anchors for direction. In this Trade Setup for 15 October, dhwani patel breaks down 10 key trade cues, merging those levels with fresh analysis and tactical insight geared to intraday and swing frameworks. Let’s walk through these setups. Setup 1 — Nifty 50: Resistance & Support Levels (Exact from Source) Closing: 25,146 These levels outline the immediate range where price is expected to react.If Nifty sustains above 25,268, momentum buyers may test higher resistances near 25,422. Conversely, a fall below 25,077 could drag the index toward 25,000 psychological support. From a Nifty futures trading guide perspective, this 500-point band (24,900–25,400) acts as the tactical playground for intraday traders. Setup 2 — Bank Nifty: Defined Bands to Observe Bank Nifty continues to oscillate within a tight band, showing early signs of exhaustion after recent upswings. A breakout above 56,786 could attract renewed buying toward 56,974 and 57,600, while a breach below 56,179 may trigger pressure toward 55,991–55,545. These zones will be crucial for traders deploying index futures trading strategies India, as the financial index often dictates overall market momentum. Setup 3 — Option Chain Analysis Nifty Call OI Concentration: 25,300, 25,400, and 25,500Nifty Put OI Concentration: 25,100, 25,000, and 24,900 Bank Nifty Call OI: 57,000 and 57,500Bank Nifty Put OI: 56,000 and 55,500 Interpretation:The market’s OI structure suggests a tightly contested zone. If Nifty closes above 25,300, it could spark call unwinding and short-covering. Conversely, fresh put writing near 25,000 would reaffirm support. Options traders should avoid naked positions and prefer spreads or straddles within this narrow volatility environment. Setup 4 — Put-Call Ratio (PCR) & Sentiment The PCR remains balanced, indicating a neutral bias. However, a sudden rise in PCR above 1.2 could imply excessive optimism, while a drop below 0.8 may signal bearish undertones. In essence, sentiment remains steady — traders are neither euphoric nor fearful. Use PCR as a secondary indicator to confirm breakouts or reversals. Setup 5 — Volatility Gauge: India VIX India VIX continues to hover in a low range near 10–11 levels, showing calm sentiment.But as dhwani patel often says: “Low volatility is like silence before thunder — when it breaks, the move is sharp.” Traders should be ready for sudden spikes in VIX if global cues shift or if Nifty breaks out of its 25,400 resistance band. Setup 6 — Derivative & OI Movements The derivatives data shows: This pattern suggests that the broader market remains selective. Stock-specific strategies may outperform index trades in the near term. Swing traders should align setups with swing trading strategies India, focusing on delivery-backed moves rather than intraday noise. Setup 7 — Sectoral Overview A cross-sector rotation can define the next directional impulse — especially if FIIs start realigning positions post-result season. Setup 8 — Global & Domestic Cues Global indices traded mixed overnight — US markets were flat, Asian peers mildly positive, and crude prices hovering around stable levels.Domestically, bond yields remain in check, supporting equities. However, traders should monitor any changes in global risk sentiment as they can quickly alter intraday bias. Setup 9 — Intraday Trade Playbook Index Bullish Above Bearish Below Neutral Zone Nifty 50 25,268 25,077 25,100–25,250 Bank Nifty 56,786 56,179 56,300–56,700 Plan of Action: Setup 10 — dhwani patel’s View “The market is in a phase where conviction is built through confirmation. Let the price move first — your capital is best used on evidence, not anticipation.” The Trade Setup for 15 October 2025 points to a stable yet sensitive market. Expect range-bound behavior in the first half, followed by directional cues from Bank Nifty in the second half. Traders should maintain patience and agility — the next big move will emerge once volatility returns. Key Takeaways Final Thoughts This Trade Setup for 15 October 2025 gives you the map — not the motion. The market will choose direction; your edge comes from preparation and execution. As dhwani patel always reminds her readers —
Trade Setup for 14 October 2025 by dhwani patel
Introduction Markets thrive or wobble based on how participants interpret key zones, flows, and direction cues. For October 14, 2025, the trade setup is shaped by resistance and support levels published in the recent market brief, alongside derivative and volatility data. In this article, dhwani patel breaks down 10 trade-relevant setups using those levels plus original insight — designed for both intraday and short swing traders. Let’s get into it. Setup 1 — Nifty 50: Resistance & Support Zones According to the updated market summary, resistance for the Nifty lies close to 25,650–25,700, while support zones are in the 25,300–25,250 region. This band will act as the primary battlefield. If Nifty pushes above 25,650 with conviction, further upside may unfold. On the flip side, a drop below 25,300 can invite broader weakness. Traders using a Nifty futures trading guide can reference this zone to shape directional bias: stay alert for clean breaks or retests. Setup 2 — Bank Nifty: Financial Index Barometer In the same report, Bank Nifty’s resistance is placed near 57,600–57,800, with support zones around 56,800–56,500. Since banks carry disproportionate weight and sentiment influence, this index often leads or confirms the broader market’s direction. If Bank Nifty breaks above 57,800 convincingly, expect more participation in financial counters; if it falters below 56,800, it may drag broader indices. For those employing index futures trading strategies India, watching Bank Nifty’s reaction within these levels can give early clues on strength or weakness. Setup 3 — Call OI Concentration: Resistance Clues Call open interest is concentrated at strikes like 26,000, 25,800, 25,700 (as per the report). These levels may act as supply zones where participants expect price struggles. When price approaches these strikes: Options traders and futures traders alike should watch such zones when planning entries or stops. Setup 4 — Put OI Pivots: Support Anchors Heavy put interest resides at strikes such as 25,300, 25,200, and 25,000 (as mentioned). These create implied support zones. If Nifty drifts toward these zones and holds, buyers may step in. But a decisive breach, especially with increase in put OI, could signal a shift to downside momentum. Traders can treat these as reference support bands for bias shifts or defensive posture. Setup 5 — Bank Nifty Option Structure Bank Nifty’s call OI shows heavy clustering around 58,000 and 57,500, while on the put side, strikes like 56,000 draw significant interest. This suggests resistance near 58,000 and support near 56,000. If Bank Nifty breaks past 58,000, it may carry momentum into broader indices; but if it retreats, those put zones may buffer downside. Using these with futures strategies helps align entries with where major participants have positioned. Setup 6 — Put-Call Ratio (PCR) & Market Mood Rising PCR indicates more participants hedging or expecting downside, while a declining PCR suggests risk appetite. Use PCR shifts as a confirmatory filter — when price nears key levels and PCR moves in tandem, it strengthens conviction. But don’t treat PCR alone as a trade trigger. Setup 7 — Volatility & India VIX The market commentary suggests volatility may remain stable but susceptible to spikes. If India VIX jumps during the session, the range may expand and directional edges may get more pronounced. Traders should be ready for both scenarios: extended runs or sharper reversals. Setup 8 — Flow & OI Dynamics The report highlights long build-ups, short covering, and OI shifts across stocks. Recognizing which counters are seeing aggressive positioning gives hints about where institutional money is flowing. Combine that with relative strength and technical structure to filter better names for swing or intraday action. Setup 9 — Delivery Data & F&O bans Stocks showing high delivery percentages reflect true accumulation beyond speculative interest. At the same time, stocks under F&O ban tend to behave erratically since new positions can’t be added freely. Knowing which names fall in these categories helps you avoid traps and capture higher-quality setups. Setup 10 — Macro & Global Backdrop Global cues — crude, U.S. futures, bond yields, policy news — act as accelerators or spoilers. Even if domestic levels hold, external shocks can override direction quickly. Traders should monitor global indices and commodity price moves throughout the session as overlay context. Integration into a Trading Framework Here’s a suggested workflow (educational, not trade recommendations): This aligns well with principles behind index futures trading strategies India and fits naturally with swing trading strategies India thinking. Final Thoughts & Reminder This Trade Setup for 14 October 2025 uses the resistance and support levels from the published market summary, but the insight, structure, and analysis here are entirely original. As dhwani patel, I always remind: Charts and levels help you see the terrain; your judgment, discipline, and risk controls determine your success. ⚠️ All trading and investment decisions are subject to market risk. Disclosure & Disclaimer: dhwani patel (SEBI Registration No. INH200008608) is a SEBI registered research analyst. The content here is for educational purposes only and is not intended as investment advice or recommendation. Always do your own research or consult a registered advisor before making trading decisions.

Stocks to Watch Today — 14 October 2025 by dhwani patel
Introduction Every trading day brings surprises. Some stocks move on earnings, others on deal announcements or sectoral rotations. For October 14, 2025, certain names stand out based on recent news, fundamentals, and technical setups. In this blog, I highlight stocks to watch today, give you what to look for (breakout levels, catalysts), and explain risks — so you have a roadmap before the market opens. Let’s dive in. Key Stocks Under Watch Here are the names that are expected to be in focus today (with their likely triggers and what to observe). This is not a recommendation, but a watchlist for alert traders. What to Watch: Technical / Market Signals For the stocks above, here are generalized signals you can monitor to help filter setups: Using such frameworks aligns with how you might blend index futures trading strategies India or swing trading strategies India into your daily watchlist. Risk & Caution Notes Final Thoughts A watchlist helps you stay alert to opportunity without forcing trades. On October 14, names like HCL Tech, LT Foods, Waaree Energies, Tata Steel, Eicher Motors, Anand Rathi could see action depending on news, sector sentiment, and technical breaks. As dhwani patel, I’d treat these as names to monitor for momentum — not guaranteed trade ideas. Use them to filter potential setups, then apply your rules, risk framework, and trade only when confirmation appears. ⚠️ Disclaimer: All views here are educational. Trading and investment decisions are subject to market risk.

How to Do Commodities Trading in India — A Complete Guide by dhwani patel
Introduction The commodities market in India is one of the oldest and most dynamic parts of the financial ecosystem — yet, for many retail investors, it still feels like uncharted territory. From gold and silver to crude oil and agricultural products, commodities offer unique opportunities to diversify portfolios and hedge against inflation. In this blog, dhwani patel, a SEBI registered research analyst and founder of Finversify, explains how to do commodities trading step-by-step — what it means, how it works on the MCX (Multi Commodity Exchange), and the strategies beginners can use to get started confidently. 1. Understanding What Commodity Trading Means Commodity trading involves buying and selling raw materials — metals, energy, and agricultural products — either in the spot market (immediate delivery) or the futures market (delivery at a future date). In India, most trading happens through commodity futures contracts on recognized exchanges such as: Each futures contract represents a standard quantity and quality of a commodity — say 1 kg of gold, or 100 barrels of crude oil — and is traded for a future date at a predetermined price. 2. Why Trade Commodities? Commodity trading attracts a wide range of participants — hedgers, speculators, and investors — because it provides multiple benefits: 3. Key Players in the Commodity Market Each group adds liquidity and balance to the ecosystem. 4. How to Start Commodities Trading in India If you’re wondering how to do commodities trading practically, here’s the roadmap: Step 1 — Learn the Basics Before trading, understand the contract specifications — lot size, expiry date, margin requirements, and tick value. Exchanges like MCX publish detailed information about each commodity. Step 2 — Choose a Reliable Broker Select a SEBI-registered broker who provides access to MCX and NCDEX. The best commodity trading platform in India offers: Some popular full-service and discount brokers include Zerodha, Angel One, and ICICI Direct. Step 3 — Open a Trading & Demat Account While most commodity trades are settled in cash, a Demat account helps store delivery-based positions. Submit your KYC documents and link your bank account. Step 4 — Fund Your Account Deposit the required margin to begin trading. Remember, futures are leveraged instruments — a 5% margin means you can control ₹10 lakh worth of gold with ₹50,000 margin. Step 5 — Analyze the Market Combine fundamental analysis (supply, demand, geopolitical risks) with technical analysis (charts, patterns, indicators). This dual approach gives traders an edge. Step 6 — Place Your Trade Once confident, select your contract (e.g., Gold December Futures on MCX), choose quantity, and place a buy/sell order. Step 7 — Monitor & Exit Track positions continuously. Futures can be squared-off before expiry or carried forward. Always define your stop-loss and profit targets. 5. Commodity Categories You Can Trade Category Examples Key Drivers Precious Metals Gold, Silver Inflation, currency strength, central-bank policies Base Metals Copper, Zinc, Nickel, Aluminium Industrial demand, global growth Energy Crude oil, Natural gas OPEC decisions, geopolitical events Agricultural Cotton, Soybean, Chana, Sugar Weather, harvest cycles, demand-supply dynamics Each commodity behaves differently — for instance, crude oil reacts to global tensions, while gold moves inversely to the dollar. 6. Understanding Margins and Leverage In commodity futures, traders pay only a margin (5–10% of contract value). Leverage magnifies profits and losses alike. Example: Hence, risk management is crucial — never over-leverage or trade without stop-loss. 7. Common Mistakes Beginners Make 8. Effective MCX Trading Strategies for Beginners Here are foundational approaches suitable for new entrants: (a) Trend-Following Strategy Trade in the direction of prevailing momentum — use moving averages (50-EMA, 200-EMA) to identify trend continuation setups. (b) Breakout Strategy Identify key support/resistance zones. When price breaks with strong volume, enter in the direction of breakout. (c) Spread Trading Take opposite positions in two related contracts (like Crude Oil Oct vs. Crude Oil Nov) to benefit from differential moves. (d) Mean Reversion When a commodity deviates significantly from its average price, anticipate a return to mean levels — but confirm with volume. Each of these fits within swing trading strategies India, where trades last from a few hours to several days. 9. Taxation on Commodity Trading Consult your CA to ensure proper accounting and compliance. 10. dhwani patel’s Professional Insights As a SEBI registered research analyst, dhwani patel emphasizes discipline, education, and risk awareness before entering commodities. “Commodities reward informed traders. Learn how margin, volatility, and liquidity work before chasing returns. A structured trading plan and controlled position sizing turn speculation into a skill.” She also recommends starting small — perhaps with MCX mini contracts — before scaling. 11. Risk Management Essentials 12. Technology & Tools to Help You Trade Better Top commodity trading platforms in India provide analytical dashboards, OI heatmaps, and charting features: Combine platform tools with your index futures trading strategies India workflow for a comprehensive market view. 13. Building a Long-Term Edge The commodity market is cyclical — global demand, policy shifts, and economic cycles shape it. To stay relevant: Over time, a trader’s edge is built on discipline + data + patience, not hunches. Conclusion Learning how to do commodities trading is not just about placing buy/sell orders — it’s about understanding risk, leverage, and the rhythm of global markets. Whether you’re trading gold, crude, or copper, knowledge and risk management determine longevity. As dhwani patel advises, “Don’t treat commodity trading as a guessing game. Treat it as a business — plan, execute, review.” With a structured approach, reliable brokers, and continuous learning, commodities can be a powerful addition to your trading journey. ⚠️ Disclaimer: All trading and investment decisions are subject to market risk. Disclosure & Disclaimer: dhwani patel (SEBI Registration No. INH200008608) is a SEBI registered research analyst. The views expressed here are for educational and informational purposes only and do not constitute investment advice or a recommendation to buy/sell securities or commodities. Market conditions are subject to change. Readers should perform their own due diligence or consult a licensed advisor before acting.
Trade Setup for 13 October 2025 by Dhwani Patel
Introduction As markets gear up for October 13’s opening, traders will lean heavily on cues from global indices, derivative flows, and sector rotation. A few crucial levels and structural cues will likely influence intraday bias and short swing opportunities. In this Trade Setup for 13 October 2025, dhwani patel, SEBI registered research analyst and founder of Finversify, presents 10 trade-relevant setups to monitor before the bell. Use these as guides—contextual inputs—not rigid prescriptions. Setup 1 — Nifty 50: structural zones to respect From pre-market data: resistance near 25,400–25,450, and support around 25,200–25,100 were noted as key zones. These ranges frame any early bias. Why it matters:These levels act as magnets or rejection zones. If Nifty stays inside the band, expect choppy trade; a directional breakout (with confirmation) should dictate flow. How to frame it: Setup 2 — Bank Nifty: pivot and triggers Bank Nifty’s pivot range for the session was identified with resistance near 57,200–57,400 and support around 56,600–56,400. A failure to breach resistance could invite short-term reversals. Why it’s critical:Banking index momentum often leads and confirms the broader indices. When Bank Nifty is strong, it lifts financials and related sectors. Trader’s lens: Setup 3 — Call Open Interest Clusters Key call strikes with heavy open interest include 26,000, 25,800, and 25,600. These strike levels may serve as resistance traps if price approaches them. Interpretation:Clusters of call OI often signal where large participants expect upside to slow. If price nears these points, observe volume / OI movement to test strength. For options players: Setup 4 — Put Open Interest & Support Floor On the put side, strikes like 25,200, 25,000, 24,800 displayed the largest concentrations of OI. These make for reference floors—especially if Nifty dips. Why useful:Strong put OI zones often act as soft supports or magnet zones. A breach below them usually leads to quick downside acceleration. Use advice: Setup 5 — Bank Nifty Options: mapping financial bias In Bank Nifty’s options chain, the highest call interest lay near 57,500, followed by 57,000; on the put side, strikes like 56,000 and 55,500 registered heavy OI. What this suggests:There is an expectation that Bank Nifty may struggle beyond 57,500; support is likely clustered nearer to 56,000. For index futures strategies, monitoring how Bank Nifty behaves relative to these option levels gives early cues on where traders are placing hedges or bets. Setup 6 — Put-Call Ratio & Trader Sentiment An elevated PCR (above its short-term average) suggests that more participants are buying protection or expecting downside. Conversely, a falling PCR indicates more optimistic sentiment. Given Mercury’s projection in the pre-market report, shifts in PCR around intraday highs/lows will offer confirmation or warning signs of trend exhaustion. How to integrate: Setup 7 — India VIX: volatility context Pre-market data showed India VIX in a moderate range, indicating market participants see some room for volatility. A sudden spike could trigger option-based rebalancing. Why it’s key:VIX jumps often precede intraday reversals or trend changes — especially when markets are extended. Tactical note:If VIX remains steady, trades with tight risk/reward can work well; if it steps up, use smaller sizing or protective hedges. Setup 8 — Flow Profiles: long builds, unwinds, shorts The pre-session report flagged notable long build-ups in many stocks, some short covering, and pockets of unwinding. Tracking which names are seeing aggressive positioning can highlight where institutional interest lies. Why it matters:These flow signals often lead price — especially when they align with technical patterns. Usage idea for swing traders: Setup 9 — Delivery Data & F&O Bans High delivery percentages in certain stocks indicate actual accumulation rather than intraday noise. Note also which stocks are in the F&O ban list — such names behave erratically because new positions are limited. Why important:If a name is seeing high delivery + participation, it’s more likely to have sustainable momentum. Banned names, conversely, pose added structural risk. Practical use: Setup 10 — Macro Cues & Global Markets Global markets, US yields, crude trends, and currency moves continue to set the backdrop. Pre-market summary indicated that US futures were marginally down, crude oil prices were firm, and Asian peers opened with mixed cues. Why it’s relevant:Domestic flows (especially FII) often depend on global risk appetite. A shift in US or commodity cues can cascade quickly into Indian markets. How to stay prepared: Building a Practical Checklist from These Setups To help convert these 10 insights into structured approach, here’s a sample checklist (educational — not trade instructions): This framework aligns with index futures trading strategies India and meshes well with swing trade principles. Final Thoughts & Disclaimer The Trade Setup for 13 October 2025 lays out structured cues — from index zones, option flows, Bank Nifty pointers, to macro heads-up. All trading and investment decisions are subject to market risk. Disclosure & Disclaimer: dhwani patel (SEBI Registration No. INH200008608) is a SEBI registered research analyst. This blog is for informational and educational purposes only, and does not constitute investment advice or a recommendation to buy/sell securities. Market conditions change, and readers should perform their own due diligence or consult a qualified financial advisor. SEBI does not endorse or approve any research provided by analysts.