Narayana Hrudayalaya – 20% Upside?

Narayana Hrudayalaya – 20% Upside?
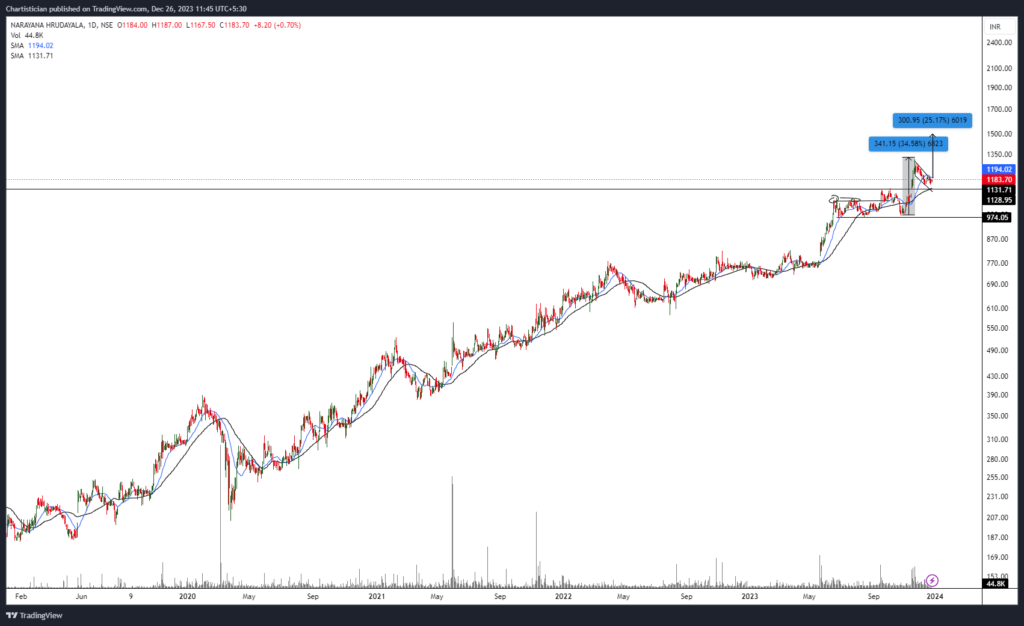
NH is retracing for a Dip further to extend the bullish rally to the new ATH. The chart structure is a classic example of how stock consolidates and moves out to break and how previous resistance becomes support.

After the breakout from a rectangular pattern, the stock rallied towards 1,300 odd levels and, at present, is undergoing a correction, which is forming a flag pattern. The flag is a short-term continuation pattern widely traded and observed by traders and short-term investors. This pattern allows entering an upward-trending stock at a reasonably favourable price with lower risk.
The Volumes display classic behavior as they continue to deteriorate throughout the pattern, but a recent surge is seen as we observe a partial fill. A partial fill usually indicates the direction of the eventual breakout.
The midterm 50 Days Moving average continues to slope up, indicating the overall trend is positive, while contraction of 20 and 50 MA indicates the stock has strong support in the zone of 1130 – 1150.
Lastly, This level coincides with the previous Top of the rectangle pattern at the 1132 level. Hence, the previous resistance acts as a support, an inflection point.
All this evidence suggests that short-term to mid-term investors and traders must keep a close watch on NH, which must be on your watchlist.
We recommend a Buy on NH at 1180 – 1150 levels for an upside to 1280 and a further 1496 (0.75x of Pole).
Stops for this position can be kept at 1120 on a closing basis; hence, the R: R is 2X and is much more favorable in the mid-term.
Happy Investing
Finversify