So it all boils down to simple method for trend identification.
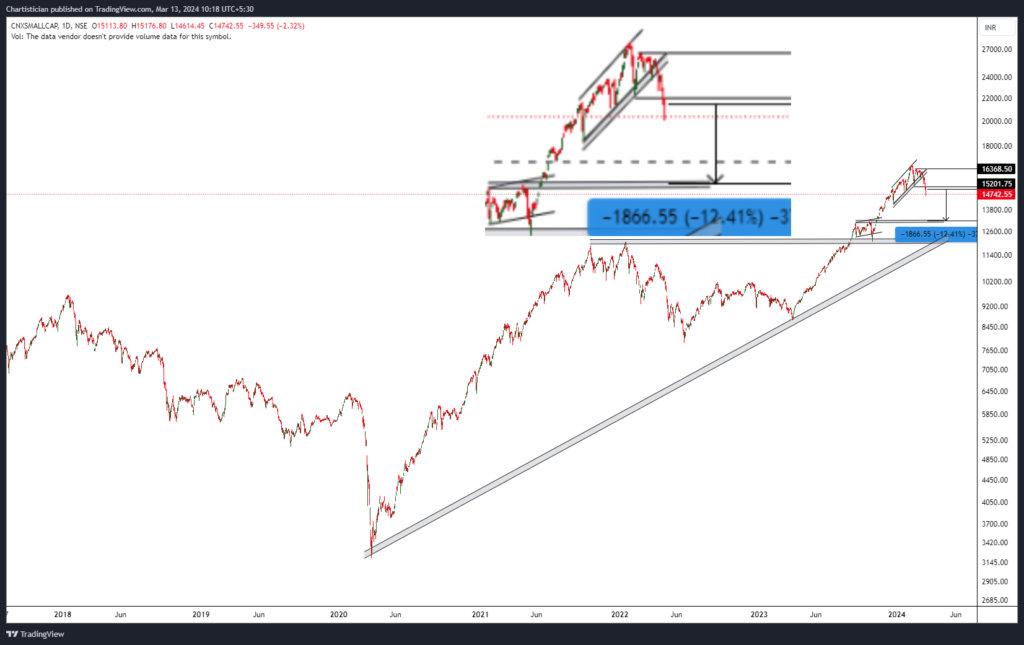
A bullish rally setup which has been making higher high and higher lows has breached its previous higher low indicating we are in for some sideways to corrective phase.
A new lower low indicate impending correction, but, till what levels?
Another approach in technical analysis teaches us – “previous resistance become support and support become resistance”.
Going forward, CNXSMALLCAP may correct towards lower levels of 13000 – 12100, which is a12-19% correction. It is located at its ATH of 2023 – 2022.
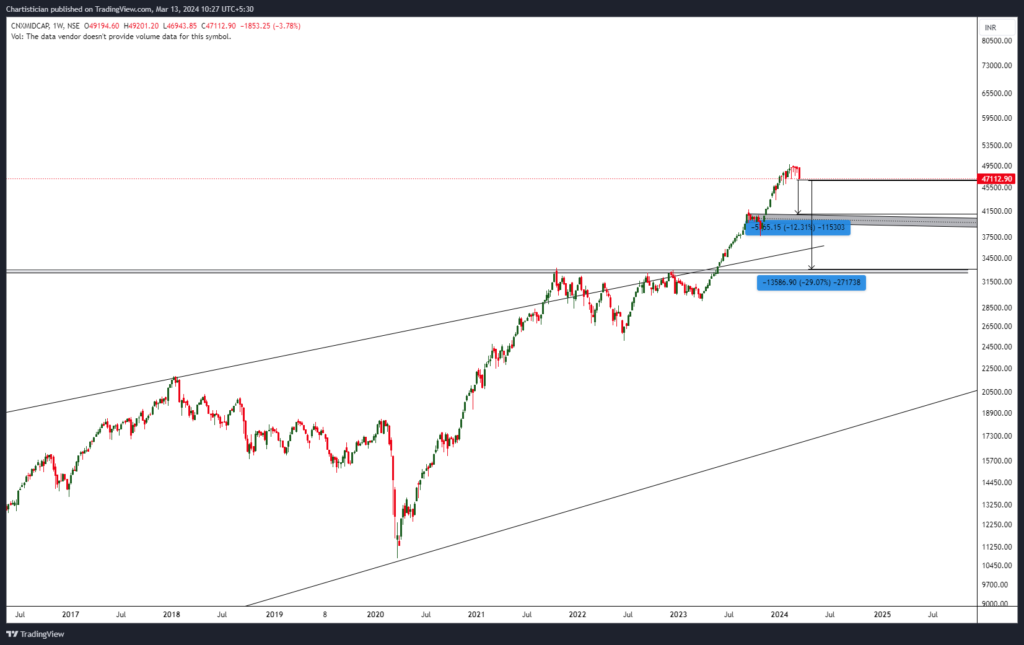
We can see similar setup in CNXMIDCAP but below 12%, pain is much higher in terms of price.
All we can be is to stay cautious. Be very selective in approaching stocks as they will move and rally but not in a frenzy which we have seen in past few months.