
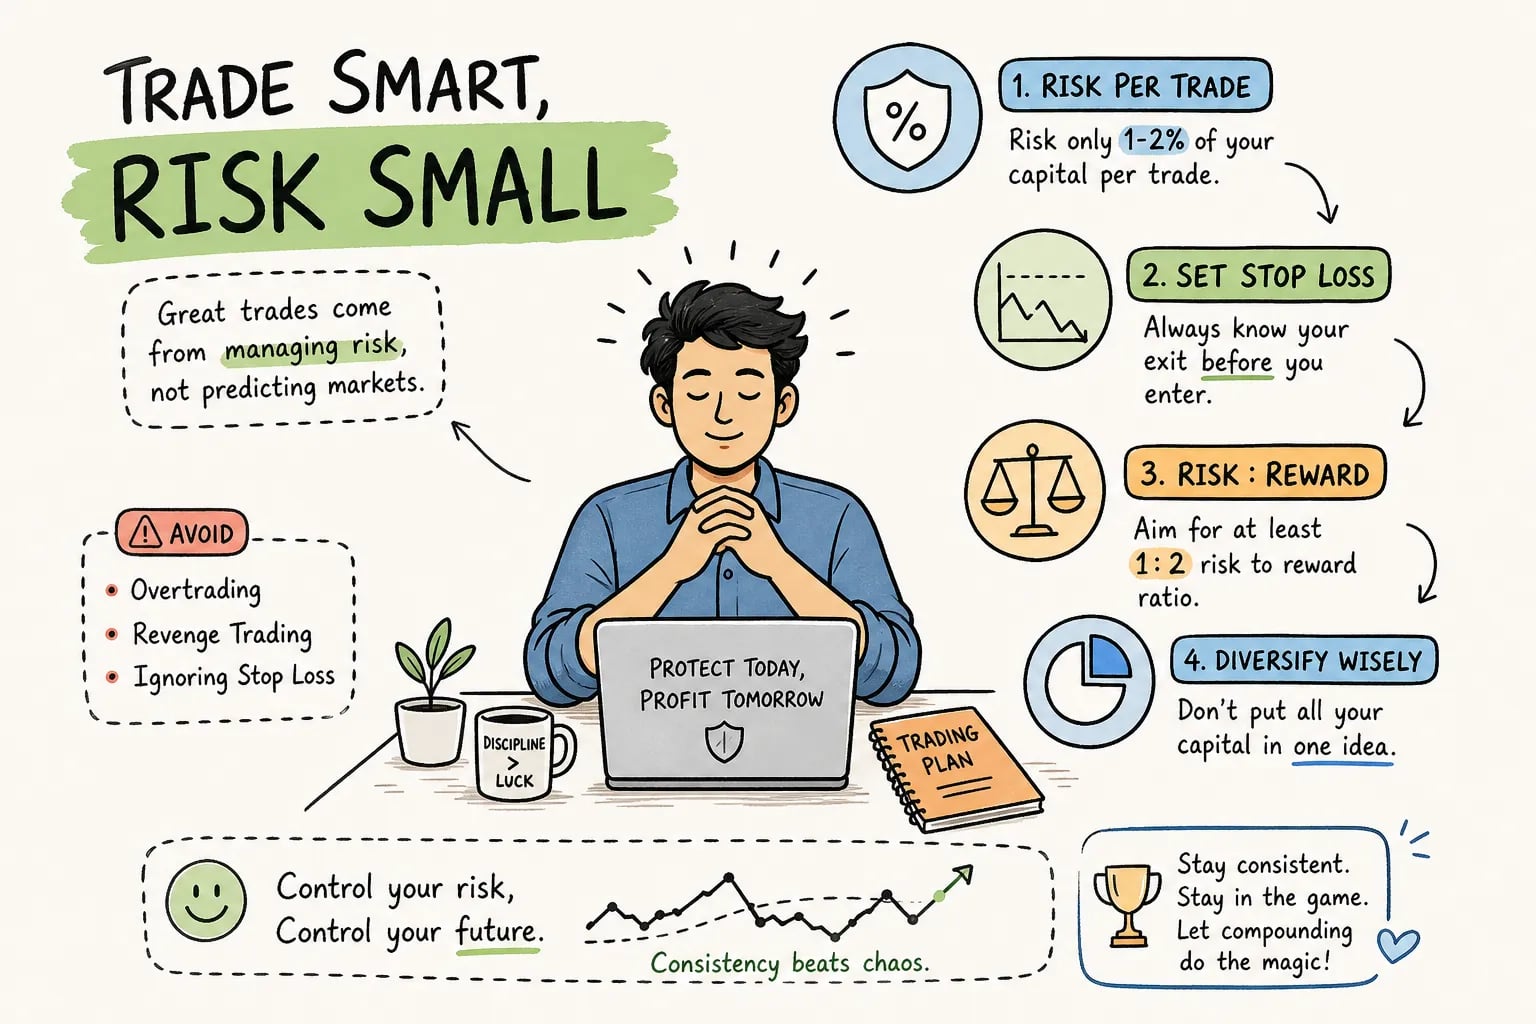
Trading risk management is the reason most Indian retail traders survive losing streaks, and the reason those without it do not. Most traders who blow up their accounts do not lose because they consistently picked the wrong stock. They lose because they had no plan for how much to lose on any single trade. One unprotected position in Bank Nifty futures, one leveraged options lot bought on a rumour, one stop-loss that never got placed: any of these can quietly erase weeks of disciplined gains in a single session. The financial damage is painful enough. The psychological fallout, the desperate trades that follow, compounds it further.
Risk management in trading is not a theoretical exercise reserved for institutional desks. It is the operating system your entire trading activity runs on, and without it, even genuinely good trade ideas will eventually destroy your account. This article gives you a complete framework covering risk per trade, position sizing, stop-loss rules, reward-to-risk filters, and leverage guardrails, built specifically for Indian retail traders in equities and F&O. Every calculation here is one you can replicate with your own account numbers today.
Why unmanaged risk destroys accounts before bad picks do
The compounding damage of one outsized loss
There is a brutal asymmetry in trading losses that most people never sit down and calculate. Lose 50% of your capital and you need a 100% gain just to return to your starting point. Take a smaller but still outsized hit: a ₹2,00,000 account that absorbs a ₹60,000 loss on one poorly sized trade now requires a 43% return before the trader is back to square one. That 43% target, on a depleted capital base, is not just difficult, it changes the trader’s behaviour in ways that make further losses more likely.
In an options trade gone wrong, the maximum loss is theoretically capped at the premium paid. But leverage multiplies both the financial and emotional damage. A trader who bought three lots of a Nifty weekly call for ₹120 premium and watched it expire at ₹10 has not just lost money on that trade. They have likely lost the rational objectivity needed to assess the next trade clearly, a pattern well documented in behavioural finance research on escalation of commitment and loss aversion. Position sizing is the mathematical solution to this problem: it ensures that no single trade, however badly it goes, can take a meaningful percentage of your account with it.
How emotion floods in when there is no framework
The cycle is predictable. No stop-loss means the trader waits, hoping the trade recovers. When it does not, they exit at the worst possible price, usually on a surge of panic. Revenge trading follows immediately: a larger position, entered hastily, to make back what was lost. In the Indian retail F&O space, where intraday Nifty and Bank Nifty moves can occasionally swing 200 to 300 points in under an hour, particularly around expiry or major news events, this cycle can consume a significant portion of an account in a single morning session. A trading risk management plan is not just about arithmetic; it is the only structural protection against this very human, very destructive pattern.
Trading risk management: position sizing strategies that keep you in the game
The 1, 2% rule and what it means in real INR terms
The foundational rule is simple: never risk more than 1, 2% of your total trading capital on a single trade. For beginners, 0.5, 1% is more appropriate. A ₹5,00,000 trading account risks ₹5,000 per trade at 1%. Even ten consecutive losing trades, an extreme and statistically unlikely streak, costs ₹50,000, leaving 90% of capital intact and the account still functioning. That survivability is the entire purpose of this rule.
The contrast is stark. Consider two traders with a ₹5,00,000 account: one risking 1% per trade and another risking 20%. After just four consecutive losses, the second trader has lost roughly 59% of their capital and now needs a 144% return to recover, an almost impossible target. The first trader has lost under 4% and can continue trading calmly. Traders who risk 10, 20% per trade find themselves unable to trade after three or four bad ones, often at the precise moment where a careful, well-sized approach would have turned the tide.
Step-by-step position sizing strategies for equity swing trades
The formula is straightforward: Position Size = (Account Capital × Risk %) ÷ (Entry Price − Stop-Loss Price). Take a mid-cap stock with an entry at ₹800 and a stop at ₹760. On a ₹5,00,000 account risking 1%, the allowable loss is ₹5,000. The stop distance is ₹40. Dividing ₹5,000 by ₹40 gives a position size of 125 shares. The key insight is that the stop-loss distance drives the position size, not a gut feeling about how many shares seems reasonable. A tighter stop allows a larger share count; a wider stop forces a smaller one. This makes position sizing concrete and repeatable.
Adjusting the calculation for futures and options lot sizes
F&O adds one layer of complexity: lot sizes are fixed, so you cannot always buy the exact number of units the formula produces. The rule here is to round down to the nearest permissible lot rather than up. Rounding up to fit a larger position means exceeding your risk budget, which defeats the purpose of the calculation entirely. For options buyers, the maximum loss is the premium paid per lot, so the formula shifts slightly: Contracts = floor (Allowable Risk ÷ Premium per Lot). A ₹5,000 risk budget divided by a ₹2,400 premium per lot allows two lots, not three.
Stop-loss techniques for trading risk management
Fixed stops: simple, clear, and non-negotiable
A fixed stop is placed at a specific price where the trade thesis is invalidated, below a key support level, below the prior swing low, or beneath a technical structure that gave the setup its logic. The advantages are clarity and simplicity: there is no ambiguity about when to exit, and the decision is made before emotion is involved. The limitation is that fixed stops do not adapt to how volatile the stock or index currently is, which can result in getting stopped out during normal price noise before the trade has had time to develop.
ATR-based stops: a better fit for volatile Indian markets
The Average True Range (ATR) measures how much an instrument typically moves over a given period, factoring in gaps between sessions. Among the most reliable stop-loss techniques available, ATR-based stops place your exit at 1.5 to 2 times the ATR below entry, accounting for the asset’s natural volatility rather than applying a one-size-fits-all distance. This approach works particularly well for F&O instruments like Nifty and Bank Nifty, where daily ranges are large and a fixed-rupee stop would be triggered too easily by normal intraday swings. A 14-period ATR on a daily Nifty chart, multiplied by 1.5, gives a stop distance that reflects current market conditions rather than an arbitrary number.
As a worked example: if Nifty futures entry is at 24,000 and the 14-period ATR is 30 points, a 1.5x ATR stop sits at 23,955 for a long position. That stop is grounded in the index’s own volatility, not a fixed assumption about what feels comfortable.
When trailing stops make sense in equity swing trades
Trailing stops follow price as it moves in your favour, locking in gains progressively. They are best suited to trending setups where a stock is making a sustained directional move and the goal is to ride the trend rather than exit at a predetermined target. For Indian equity swing trades with a 2, 6 week holding period, a trailing stop anchored to closing prices below the 20-day moving average is a widely used, mechanical heuristic that removes the temptation to exit prematurely out of fear. The trailing stop is not about protecting a fixed profit target; it is about letting winners run within a defined structure.
Reward-to-risk ratios: the filter every setup must pass
Why 1:1.5 is the minimum, not the aspiration
The reward-to-risk ratio is a pre-entry filter, not a post-trade metric. If the stop-loss is ₹20 away from entry, the first target must be at least ₹30 away. At a 1:1.5 ratio, a strategy breaks even before costs at a 40% win rate (0.4 × 1.5 − 0.6 × 1 = 0), which means you need a win rate marginally above 40% to cover brokerage and slippage and begin generating net profit. For volatile instruments, the bar should be higher: aim for 1:2 or better. At a 1:2 reward-to-risk ratio, a win rate above roughly 33% produces positive expectancy before costs. In Nifty options, risking ₹3,000 in premium to target ₹6,000 in premium profit at 1:2 means the strategy becomes net profitable once your win rate sustainably clears that 33% threshold. Skipping a trade because it does not meet this threshold is itself a trading risk management decision.
Applying the filter to skip emotionally tempting setups
The hardest trades to skip are the ones that feel certain. The chart looks immaculate, the volume confirms the move, and every indicator agrees. Discipline here means calculating the reward-to-risk before entering, not after. If the nearest logical target does not produce at least 1:1.5 given where the stop must sit, the trade is passed regardless of how compelling it looks. This is not timidity; it is the recognition that taking low reward-to-risk trades systematically drags down overall performance even when individual trade quality is high.
Leverage and margin control: guardrails you set yourself
How leverage magnifies losses in Nifty and Bank Nifty trades
A 1% move against a 5x leveraged position creates a 5% account loss. In Bank Nifty futures, a single lot carries significant nominal value relative to the margin posted, which means even a moderate move against an unprotected position can cause meaningful capital damage quickly. Many retail traders focus on the potential gain from leverage without genuinely internalising what one bad session looks like on the loss side. SEBI’s margin framework and experienced traders converge on the same principle: leverage is a tool that requires proportionally tighter position sizing, not a mechanism for taking larger bets on the same level of conviction.
Setting daily and weekly loss limits that force a hard stop
A daily loss limit of 3% of account capital is a widely observed professional guideline among risk managers and systematic traders. Once that threshold is hit, trading stops for the day without exception. A weekly limit of 5, 7% triggers a full review before resuming the following week. These guardrails exist for one reason: to prevent a bad morning from becoming a catastrophic afternoon of emotionally driven revenge trades. Write these limits into your trading plan before the market opens on Monday, when you are calm and objective. Do not negotiate them with yourself after the losses have already accumulated.
Your pre-trade checklist and how structured calls remove the pressure
The seven questions to ask before every trade
Before entering any trade, a disciplined trader answers seven questions in sequence:
- What is my current account capital?
- What is my maximum allowable risk in rupees on this specific trade?
- Where is my stop-loss placed, and why is that the level where the trade thesis breaks down?
- How many shares or lots does that stop-loss distance allow given my risk budget?
- Does the first realistic target produce at least a 1:1.5 reward-to-risk ratio?
- Does this trade push me past my daily loss limit?
- Does it overlap with existing open positions in the same sector or underlying theme?
If the answer to any of these questions disqualifies the setup, the trade is skipped. Not reconsidered, not adjusted to force it to qualify, skipped. This makes pre-trade assessment repeatable and emotion-proof. A five-minute habit applied consistently across hundreds of trades is what separates accounts that compound steadily from accounts that cycle through boom and bust.
How pre-defined advisory calls take the calculation pressure off
For traders who understand these trading risk rules intellectually but struggle to apply them calmly during live market hours, a structured advisory service can fundamentally change the equation. SEBI-registered services such as Finversify incorporate a risk framework into every call, providing predefined entry levels, stop-loss prices, and exit targets together, so the trader is not required to calculate reward-to-risk or stop placement under the pressure of a moving market. Readers are encouraged to independently verify any advisory service’s SEBI registration and track record before subscribing. For beginners and intermediate traders building their skills, working with rule-based calls is a practical way to practise disciplined trading with real money while learning the rationale behind each decision.
A framework worth following consistently
Trading risk management is not a constraint on returns. It is the foundation that makes consistent returns possible in the first place. The framework itself is straightforward: risk 1, 2% per trade, place the stop-loss before entry, derive your position size from that stop distance, require a minimum 1:1.5 reward-to-risk on every setup, enforce a daily loss limit of 3%, and run the seven-question pre-trade check on every trade without exception.
The harder truth is not complexity, it is consistency. The traders who follow these retail trader risk rules through losing streaks, through volatile expiries, through the temptation to double down after a bad week, are the ones whose accounts are still active and growing two years from now. Save this checklist, revisit it before every trading session, and apply it without negotiation. If you want to see what structured, rule-based trade calls look like in practice, Finversify’s Telegram channel delivers recommendations with entry, stop-loss, and target already defined, a useful reference for understanding how a complete risk framework translates into live trade calls.
Disclosure: Finversify is a SEBI-registered investment advisory. This article contains references to Finversify’s services for illustrative purposes. Readers should independently verify registration details and assess suitability before acting on any advisory recommendation.