
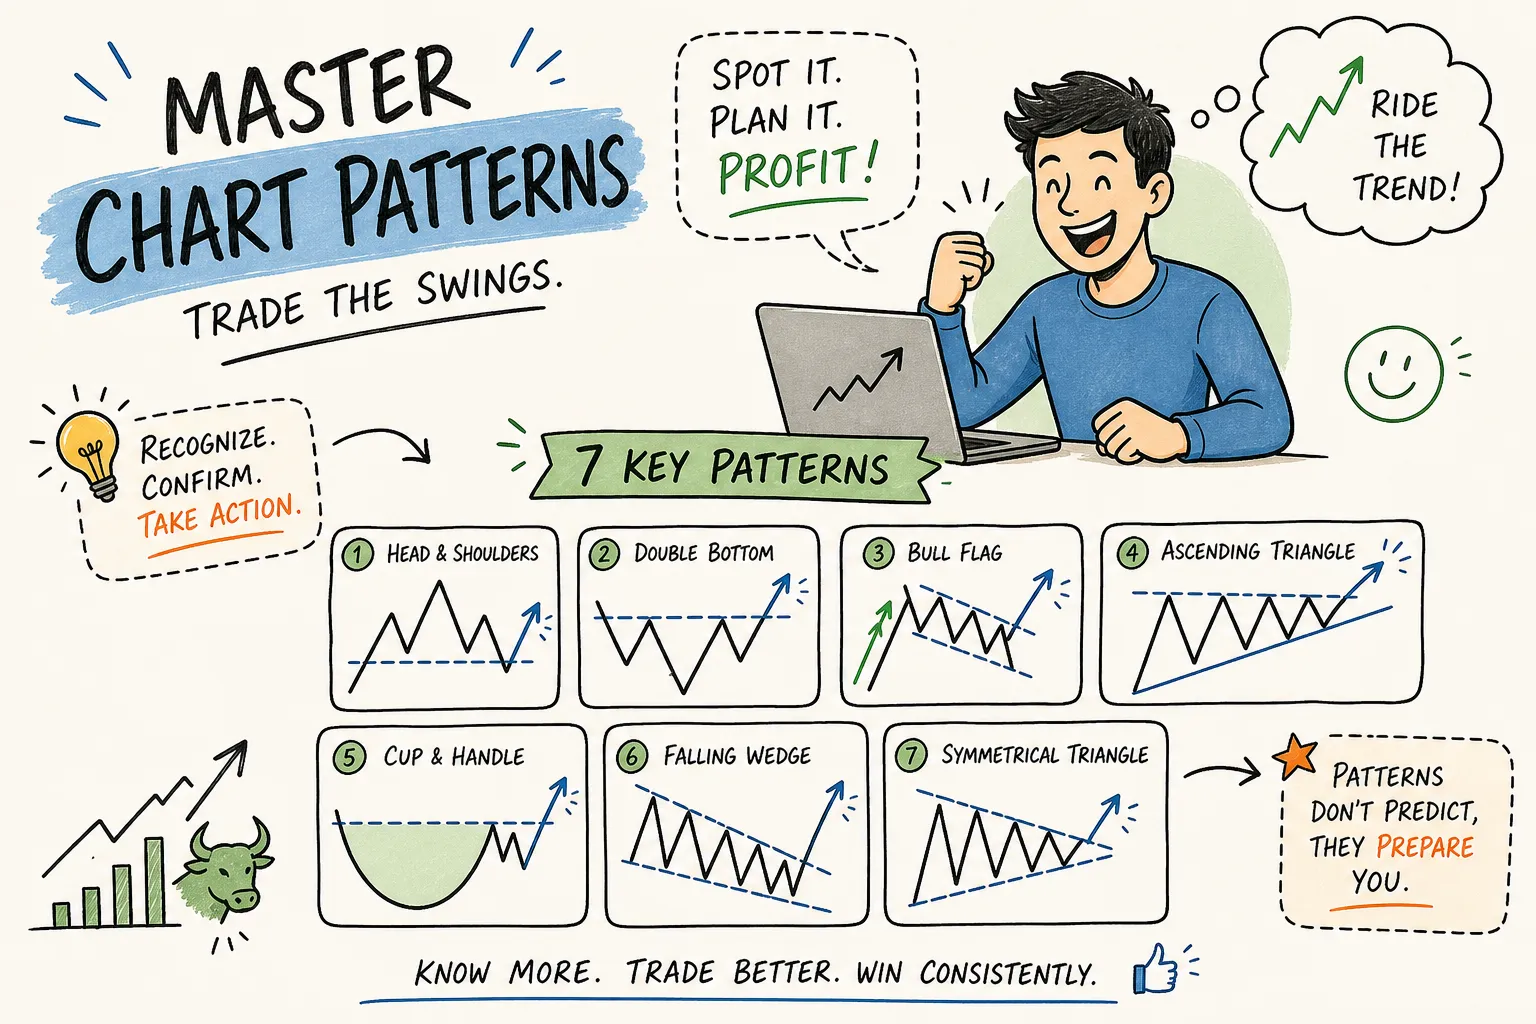
A common reason swing traders lose money is not that the market is chaotic, but that they react to price rather than read it. Chart patterns change that equation. Learning how to identify common chart patterns for swing trading gives you a structured, repeatable framework for anticipating where price is likely to move before the move begins, and that single shift from reactive to prepared is worth more than any indicator setting you will ever tweak. This guide covers seven patterns every swing trader should master, the rules to act on each one, and how to separate a real breakout from a trap.
At Finversify, every swing recommendation is anchored to a recognisable price structure on the daily chart, with the supporting rationale shared alongside the alert, so every call becomes a setup to understand, not just act on.
How to identify common chart patterns for swing trading, reversal patterns
When a trend is about to exhaust itself, price rarely reverses in a straight line. It leaves a signature, and learning to read that signature early gives you a genuine advantage: entering a new trend at its beginning rather than chasing it midway. The four reversal patterns below are among the most widely used high-probability setups in swing trading precisely because they mark the transition from one trend direction to another.
Head and shoulders and its mirror image
The Head and Shoulders pattern forms at the peak of an uptrend. Price makes a high (the left shoulder), pushes to a new high (the head), then fails to exceed that high and forms a lower high (the right shoulder). A neckline connects the lows between these three peaks. When price closes below that neckline with conviction, the pattern is complete.
The right shoulder’s lower high is the critical detail. It tells you that bulls attempted to resume the trend, failed, and are now losing control. Entry comes on a confirmed daily close below the neckline, or on a retest of the broken neckline from below. Stop placement sits just above the right shoulder, and the measured-move target equals the distance from the head’s peak to the neckline projected downward from the breakout point. The Inverse Head and Shoulders follows identical logic in reverse, signalling a bullish reversal from a downtrend with entry above the neckline and stop below the right shoulder trough.
Double tops and double bottoms: deceptively simple, widely effective
A Double Top forms when price tests the same resistance level twice and fails to break through on the second attempt. What matters most is what happens during that second peak: volume tends to be noticeably lower than on the first touch, a sign of fading conviction at the same price level and one of the clearest signals that sellers are taking over from buyers.
Entry is on a confirmed close below the neckline, the low between the two peaks. Stop goes just above the second peak, and the target is the measured move from the peak to the neckline projected downward. The Double Bottom follows identical logic in the opposite direction, producing a bullish reversal signal after a sustained downtrend. Sectors such as banking and infrastructure on the NSE can show this formation at major support levels, though confirmation via volume and neckline break remains essential regardless of sector.
Continuation patterns: the pause before the next leg up
The strongest trades are sometimes those that stay with a trend that is pausing before its next leg. Continuation patterns mark those pauses and give you a structured way to enter with defined risk in the direction of an already-established move. Knowing how to identify common chart patterns for swing trading within these consolidation structures is particularly valuable in trending markets like the NSE’s mid-cap segment.
Flags, pennants and what a healthy consolidation looks like
A Bull Flag forms after a sharp, high-momentum move upward, the pole, followed by a short consolidation that is typically a counter-trend channel or a tight converging structure. Volume contracts sharply during the flag. This is not a warning sign; it confirms that sellers are not genuinely in control. When price breaks above the upper boundary, volume must surge. That combination of contracting volume inside the pattern and expanding volume at the breakout is the hallmark of a quality setup and the foundation of reliable candlestick pattern recognition.
Entry is on a breakout close above the upper trendline of the flag. Stop sits below the flag’s lower boundary, and the target equals the length of the pole projected from the breakout point. Mid-cap NSE stocks in strong momentum phases often show flag-like consolidations before continuing their primary trend, making this one of the more practical price patterns for swing trades in the Indian market.
Triangles and the cup and handle setup
Ascending triangles carry a bullish bias because each pullback is shallower than the last, showing buyers stepping in at progressively higher levels. Descending triangles carry the inverse logic. Symmetrical triangles are neutral: breakout direction determines trade direction, and you follow the break. For all three, entry is on a confirmed close beyond the trendline, stop at the opposite trendline, and the target equals the widest part of the triangle projected from the breakout point.
The Cup and Handle deserves particular attention. The rounded recovery (cup), followed by a minor pullback (handle) and a pattern breakout confirmation above the cup’s rim, is a well-regarded bullish continuation structure in trending equities. Stop goes below the handle, and the target equals the cup’s depth projected upward from the breakout.
Choosing the right timeframe for each pattern setup
Identifying the right pattern on the wrong timeframe is one of the most common errors in swing trading. The pattern technically exists, but the context does not support it, and the trade fails for reasons that were not visible on the chart being used.
The daily chart as your setup foundation
The daily chart is the professional standard for swing trading. It filters intraday noise, reflects genuine institutional activity, and produces the cleanest signals. All seven technical chart patterns covered here should be identified and validated on the daily chart first. Trend direction, pattern boundaries and key price levels are set on the daily chart before any trade is considered.
Using the 4-hour chart for confirmation and the hourly for execution
Once the daily chart shows a pattern forming, the 4-hour chart is where you sharpen the setup. It helps confirm the breakout level with greater precision and verify that price action is following through on the signal. The 1-hour chart then serves one purpose: execution. Use it to time your entry, for instance, waiting for a specific rejection candle at a retest level, once the higher timeframes have already confirmed the trade. The sequence is straightforward: daily for trend and pattern, 4-hour for confirmation, 1-hour for entry timing.
Volume rules and how to avoid false breakouts
A clean pattern on a chart is half the work. The other half is confirming that the breakout carries genuine conviction. Price can breach any level; volume tells you whether the move has real force behind it or whether it is a trap designed to flush out poorly positioned traders.
The volume criteria that separate real breakouts from traps
A valid breakout requires volume of at least 1.5 to 2 times the 20-day average on the breakout candle itself. Below-average volume at the breakout is a significant warning sign and should prompt you to wait rather than act. Volume contracting during pattern formation is entirely normal; it reflects reduced activity during consolidation. The breakout candle must then show a clear, visible spike. That spike indicates institutional participation, and without it, the move is more likely to be retail-driven and prone to a swift reversal.
Practical steps to avoid getting caught in a false breakout
Four rules reduce false-breakout risk significantly. First, wait for a full candle close beyond the level, not just a wick that pokes through and retreats. Second, look for a successful retest of the broken level before entering, especially if you missed the initial break. Third, check your momentum indicators: if RSI or MACD shows divergence at the breakout point, the probability of failure rises sharply. Fourth, avoid placing automatic entry orders directly above obvious breakout levels, as these are precisely where institutional players tend to hunt stops before reversing direction.
A common bull-trap scenario in Nifty and Bank Nifty setups looks like this: price spikes above triangle resistance on below-average volume, tags the stops of breakout traders, then drops back inside the range within one or two sessions. Patience and volume discipline are the filters that keep you out of those trades consistently.
How Finversify uses these patterns in research-backed swing calls
Understanding chart patterns is considerably more valuable when you see them applied to real market conditions with full context and reasoning. This is the distinction between a disciplined advisory service and a generic tip provider.
Pattern recognition + context = a research-backed swing trade call
At Finversify, every equity swing trade call includes the full setup rationale: the pattern identified, the timeframe on which it is forming, the volume context, the broader trend alignment, and clearly defined entry, stop-loss and target levels. Across the monthly equity swing calls, this approach is designed to build genuine pattern recognition instincts in subscribers who might otherwise encounter these setups without understanding what they are seeing.
Why knowing the “why” behind each call changes how you trade
When you know that a specific call is based on a bullish flag breakout confirmation with a defined reward-to-risk ratio, you can follow the logic, size the position appropriately, and know precisely when the setup is invalidated. Finversify’s model of sharing the research rationale alongside each alert turns every call into practical education in price structure, building better traders over time, not merely better trade logs.
A quick pre-trade checklist for pattern-based swing trades
Before entering any pattern-based trade, run through these six steps in order. They take less than five minutes and will help filter out a significant proportion of low-quality setups, improving your discipline and risk control.
- Confirm the pattern on the daily chart first. Do not act on any pattern identified solely on shorter timeframes.
- Verify that the prior trend supports the pattern type. A reversal pattern must form at a trend extreme; a continuation pattern must form mid-trend.
- Switch to the 4-hour chart and identify the exact breakout level. The level should be clean and unambiguous.
- Confirm that volume on the breakout candle is at least 1.5 times the 20-day average. Below-average volume means you wait.
- Place your stop at the structural invalidation point specific to the pattern, the right shoulder high, below the handle, or outside the opposite trendline, rather than at an arbitrary round number.
- Calculate the measured-move target and verify the reward-to-risk ratio. Most professional practitioners use a minimum of 1:2; anything below that threshold warrants waiting for a better setup.
This checklist separates traders who enter setups because they “look good” from those who enter because the rules confirm the setup qualifies. That distinction, practised consistently, supports disciplined risk management and better long-term outcomes.
How to identify common chart patterns for swing trading, reading probability, not predicting price
Chart patterns are not a prediction tool. They are a probability framework. When you understand how to identify common chart patterns for swing trading, you are not trying to forecast the future. You are identifying structures where the odds tilt meaningfully in your favour, with a defined exit if they do not.
Each of the seven patterns covered here, Head and Shoulders, Inverse Head and Shoulders, Double Top, Double Bottom, Flag and Pennant, Triangle, and Cup and Handle, carries clear confirmation rules, defined entry and stop logic, and measurable targets. Apply them consistently with volume discipline and multi-timeframe alignment, and candlestick pattern recognition becomes one of your most reliable trading edges.
The fastest way to accelerate that recognition is to see these structures applied to real stocks in live market conditions. This is precisely what Finversify delivers each month: applied pattern analysis with full rationale, clear levels, and the kind of structured repetition that builds genuine instinct over time.