
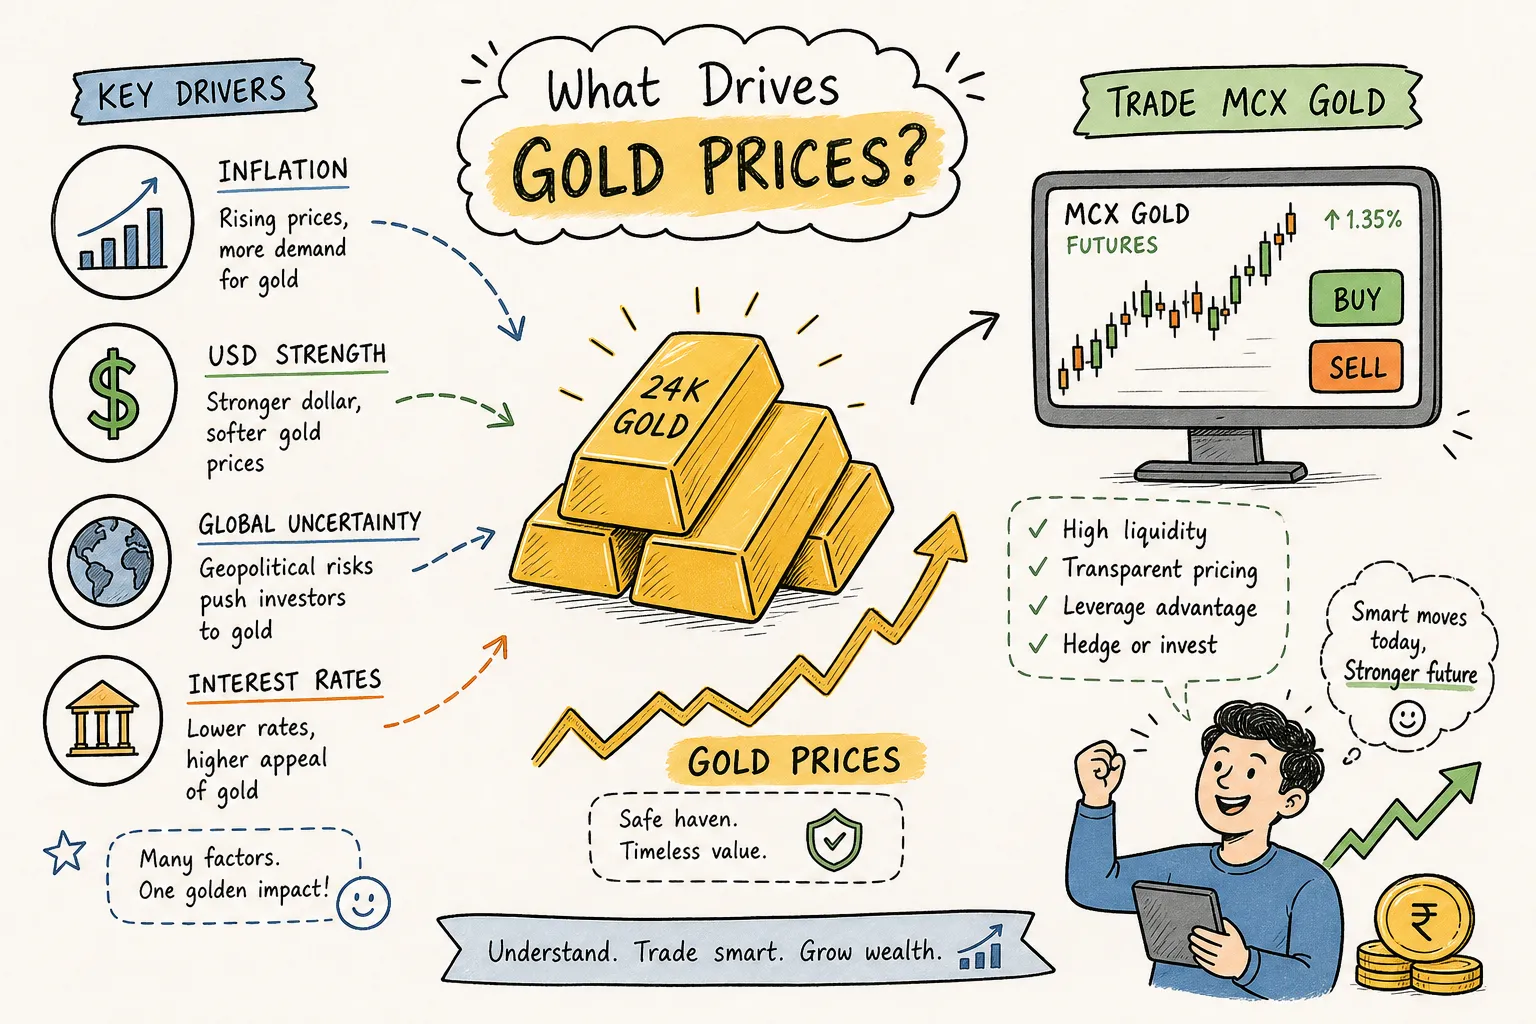
Gold prices closed at ₹14,441 per gram (24K national average) on 22 July 2026, according to aggregated live-rate data, after spending most of the previous ten days consolidating in the mid-₹14,200s range. That single-day jump of over ₹150 per gram was not random. It followed a pattern that experienced MCX traders recognise immediately: a macro trigger compressing energy into a coil, then releasing it fast. If you understand the mechanics behind that move, you are not just reading a gold rate. You are reading the market.
This article breaks down the full picture: what is driving gold prices right now, how global forces translate into the MCX gold price on your screen, how retail jewellery pricing works from that base, and what a disciplined trader or buyer should do before acting on any of it.
What gold prices are telling you right now
Live gold price India: the current 24K and 22K rate snapshot
The national average for 24K gold stands at approximately ₹14,441 per gram as of 22 July 2026 (source: aggregated live-rate portals; note that individual platforms may show minor variations, NDTV Gold Rates Today, for instance, listed ₹14,552 per gram on the same date, reflecting vendor-specific adjustments). For 22K gold, the city-wise rates tracked by jewellery associations show Mumbai and Bangalore at ₹13,890 per gram, Delhi at ₹13,905 per gram, Chennai at ₹13,950 per gram, and Kolkata at ₹13,890 per gram. These are the numbers retail buyers encounter at showroom counters, before making charges and GST are added.
The variation across cities reflects local taxes, state-level levies, and the dealer premiums that regional importers and bullion banks build into their wholesale supply chains. Chennai historically commands a slight premium, a pattern observable across IBJA daily rate data, attributable to the city’s deeply embedded gold culture and correspondingly higher retail demand. None of these rates are arbitrary; each traces back to the same COMEX spot price, filtered through the same conversion chain, with city-specific adjustments layered on top.
What the last ten days of MCX gold prices reveal
From roughly 14 July to 20 July 2026, MCX gold drifted sideways in a relatively tight band between ₹14,276 and ₹14,329 per gram. Volume was moderate and price action was unconvincing in either direction, a qualitative observation consistent with the range-bound structure, and the market appeared to be waiting. Then, on 21 and 22 July, the price moved decisively higher: ₹14,288 on 21 July, followed by ₹14,441 on 22 July. That two-day rally of roughly ₹165 per gram on a 1-kg MCX lot translates to ₹1,65,000 in raw price movement.
The character of this move matters more than the magnitude. This was not a spike driven by rumour or retail panic. It was broadly consistent with identifiable macro catalysts: dollar weakness, persistent central bank buying, and shifting real-rate expectations in global markets, though causal attribution should be read as a plausible interpretation rather than a definitive explanation, pending timestamped DXY and ETF flow data for 21, 22 July. A trader who understood the underlying forces before the move was positioned. A trader reading only price history after the fact was chasing. The question is which side of that line you want to be on for the next move.
The four forces that actually move gold prices
Inflation, real interest rates, and gold’s core role
Gold is a non-yielding asset. It pays no interest, no dividend, and no coupon. This means it competes directly with fixed-income instruments, winning that competition only when real interest rates (nominal rates minus inflation) fall or turn negative. When inflation expectations rise and rate cuts are anticipated, the opportunity cost of holding gold drops, and capital flows toward it. This logic underpins the sustained gold bull runs documented across modern financial history, including the 2008, 2012 and 2018, 2020 cycles.
In India, the RBI’s repo rate decisions and monthly CPI readings feed directly into domestic gold demand, both as a store of value and as a traded commodity on MCX. RBI working papers and MCX historical price analysis show a broadly negative relationship between repo rate hikes and MCX gold prices, and a positive relationship between rising CPI and gold prices, a dynamic also supported by World Gold Council research on Indian demand cycles. When the Monetary Policy Committee signals a dovish tilt and inflation remains elevated, the macro environment for MCX gold becomes constructive. Traders who track RBI policy ahead of meetings, rather than reacting after, carry a meaningful informational edge.
The US dollar’s inverse relationship with gold prices
The DXY (US dollar index) is the single most-watched external trigger for MCX gold movement. A weakening dollar makes dollar-denominated gold cheaper for buyers in all other currencies, which lifts global demand and pushes the spot gold price in INR higher. World Gold Council data for 2021, 2025 show a correlation of approximately −0.75 between DXY and gold during strong directional dollar moves, moderating during periods of conflicting macro signals.
For Indian traders, the USD/INR exchange rate adds a second and often underappreciated layer. A depreciating rupee can amplify the domestic MCX gold price rise even when international spot gold on COMEX is completely flat. Conversely, a strengthening rupee can absorb some of a global gold rally and keep MCX gains muted. Before entering any MCX gold position, a trader should check both variables simultaneously: the direction of DXY from the overnight US session, and the USD/INR movement in the preceding 24 hours. Both inputs belong in the pre-trade checklist.
Geopolitical events and safe-haven demand
Conflict, financial system stress, and sanctions regimes push institutional and retail capital toward gold as a hedge. The historical pattern is consistent: a geopolitical trigger produces a sharp, fast spike in gold prices, followed by a partial pullback once the initial uncertainty subsides. This structure creates exploitable short-term trading setups on MCX for traders who are already positioned in the direction the macro environment supports.
Geopolitical triggers are catalysts, not sustained trends by themselves. A safe-haven spike on a geopolitical headline, in an environment where the dollar is strong and real rates are rising, is unlikely to hold. The same spike in an environment of dollar weakness and falling real rates carries a far higher probability of developing into a sustained move. Macro context is not optional, it is the filter through which you evaluate every geopolitical trade setup.
Central bank buying and institutional ETF flows
Global central banks have been consistent net buyers of gold, and 2026 is no exception. World Gold Council data show Poland leading 2026 purchases at 64 tonnes year-to-date through May, followed by Uzbekistan at 33 tonnes and China at 25 tonnes. The People’s Bank of China has been buying for 18 consecutive months. This structural demand sets a floor under gold during corrections: when institutional sellers push price lower, central bank buyers absorb supply with a consistency that private market participants cannot match.
ETF inflows and outflows in the US and European markets provide a real-time sentiment indicator for institutional gold appetite. When central bank buying is accelerating and ETF inflows are rising simultaneously, the medium-term bias for MCX gold prices is unambiguously bullish. When ETF outflows appear despite central bank buying, it signals institutional hesitation and warrants caution about chasing breakouts. Watch both data points together rather than in isolation.
How global spot gold becomes the MCX price on your screen
The COMEX to MCX conversion chain
International spot gold is priced in USD per troy ounce on COMEX. To arrive at the MCX gold price in INR per 10 grams, the calculation runs through three layers: currency conversion, import duties, and GST. The steps are as follows:
- Take the COMEX spot gold price in USD per troy ounce.
- Divide by 31.1035 to convert from troy ounces to grams.
- Multiply by 10 for the standard MCX 10-gram quoting unit.
- Multiply by the prevailing USD/INR rate to arrive at the base INR figure.
- Apply 6% Basic Customs Duty on the landed value.
- Apply 3% Agriculture Infrastructure Development Cess on the duty-inclusive value.
- Apply 3% GST on the total landed cost.
The combined tax uplift runs to approximately 12.5% above the raw import value before any bank charges or local premium. This conversion explains why MCX gold can gap higher at market open on days when Indian markets feel quiet. A USD/INR move overnight, or a COMEX rally in the US session, feeds directly into MCX’s opening price. Traders who ignore international session price action and focus only on MCX’s previous close are working with incomplete information.
From MCX price to the retail jewellery counter
How retail gold price is calculated: the full formula
The retail price of a gold jewellery piece is calculated as: gold value (purity-adjusted) plus making charges, plus 3% GST on the combined subtotal. For 22K gold, the purity factor is 22 divided by 24, applied to the prevailing 24K base rate per gram. If 24K gold is at ₹14,441 per gram, the 22K base is approximately ₹13,240 per gram before any dealer adjustment.
To illustrate: a 10-gram 22K chain with 10% making charges carries a gold value of roughly ₹1,32,400. Making charges add ₹13,240, bringing the subtotal to ₹1,45,640. GST at 3% on that subtotal is approximately ₹4,369, bringing the consumer price to roughly ₹1,50,009. These figures are internally consistent with current 22K rates.
The city-level premium of ₹15 to ₹60 per gram visible across Mumbai, Delhi, and Chennai comes from the downstream margins that regional importers and bullion dealers build into their supply chain. These are not negotiable at the jewellery counter, but knowing they exist helps a buyer assess whether a quoted rate falls within a reasonable band before purchase.
Making Charges, Hallmarking, and the Buyback Reality
Making charges on plain items such as chains and bangles typically run between 5% and 12% of gold value. At major branded jewellers, standard designs carry charges in the 8% to 15% range, while bridal and designer pieces can reach 20% to 30% or more. At the upper end, some premium intricate sets carry making charges upward of ₹1,500 per gram, a significant and non-recoverable cost embedded in the purchase price.
BIS hallmarking certifies purity and supports resale confidence, but it does not reduce making charges and does not change buyback policy. The reality across the industry is consistent: jewellers recover gold value at the prevailing rate, not making charges or GST. A piece bought with 20% making charges has an effective ownership cost that is materially higher than its spot-linked gold value, and that gap is essentially unrecoverable at resale. For buyers who prioritise value retention, plain, hallmarked items with low making charges are structurally superior to high-design pieces of identical gold weight.
Using macro signals to time your MCX gold trades
Building a simple macro filter before entering a trade
Before any MCX gold trade, work through three questions. Is the US dollar weakening or strengthening, based on the overnight DXY and USD/INR movement? Are real interest rates declining, based on the trajectory of RBI policy and India CPI data? Is there active geopolitical risk elevating safe-haven demand? When two of the three point in the same direction, the macro environment supports a directional trade. When signals conflict, the appropriate response is to wait for clarity rather than force a position.
Macro context is a filter, not a substitute for technical levels. A bullish macro environment does not mean every MCX gold price level is a safe entry. It means the trade candidates worth considering are on the long side, and the technical levels define where specifically to enter, where to place the stop, and what target to set.
Defined entry, exit and stop-loss logic for MCX gold
For traders working with MCX gold futures in July 2026, the key technical structure is clear. Support sits in the ₹1,39,200 to ₹1,40,500 zone, with resistance at ₹1,43,500 to ₹1,45,500. A break and hold above ₹1,45,500 opens the path toward ₹1,47,000 to ₹1,47,800. A breakdown through ₹1,39,200 shifts the structure bearish, with ₹1,38,000 and ₹1,35,000 as deeper supports. These levels define the architecture of any trade, not a reason to buy or sell on their own.
For retail investors trading MCX gold futures (1 kg lot size), risk per trade must be calculated before entry, not after the position is open. A reward-to-risk ratio of at least 1:1.5 should be the minimum threshold for any trade to qualify. Stop-loss placement must respect the technical support or resistance structure and factor in MCX gold’s average daily price range and current margin requirements.
A practical checklist before you buy or trade gold today
For retail jewellery buyers: five things to verify
- Check the live 22K gold rate from a reliable source, the IBJA daily rate, NSE/BSE commodity pages, or a major live-rate portal, before stepping into a showroom.
- Confirm BIS hallmark and carat stamp on every piece, and verify the hallmark code online if the jeweller permits.
- Ask for a detailed invoice that separates gold value, making charges, and GST as distinct line items.
- Calculate the effective cost and compare the gold value component to the current MCX spot gold price per gram to understand the premium you are paying.
- Clarify the buyback policy in writing before purchasing, particularly for high-making-charge or bridal pieces.
For MCX gold traders: the pre-trade filter
- Check USD/INR movement in the last 24 hours and DXY direction from the overnight US session.
- Review COMEX spot gold direction from the previous night to anticipate MCX opening bias.
- Identify immediate MCX support (₹1,39,200 to ₹1,40,500) and resistance (₹1,43,500 to ₹1,45,500) on the daily chart.
- Confirm that at least two of the three macro filter signals align with your intended trade direction.
- Set entry, stop-loss, and target before placing the order, and size the position so maximum loss stays within your pre-defined risk budget.
Conclusion: the next move is already forming in the data
Gold prices do not move randomly. The ₹14,441 per gram rate on 22 July 2026 is the output of a specific interaction between dollar weakness, real interest rate expectations, central bank demand running at historically elevated levels, and the domestic conversion mechanics of import duty, exchange rate, and GST. None of those inputs appeared without warning; all of them were visible to anyone tracking the right data points in advance.
Retail jewellery buyers who understand pricing mechanics avoid overpaying and go into every purchase with accurate expectations about resale value. MCX gold traders who read macro signals correctly trade with the direction of structural forces rather than against them. In both cases, a defined process separates informed decisions from reactive ones.
The macro data driving the next gold price move is already accumulating in central bank balance sheet reports, DXY charts, RBI meeting minutes, and CPI readings. If you want to act on it with discipline and research-backed trade calls, Finversify’s commodity advisory, operating under SEBI Registration No. INH 200008608, provides specific entry zones, defined stop-loss levels, and exit targets, with the research rationale shared transparently so subscribers understand the process, not just the outcome. Join the free Telegram channel to see how the analysis works before committing to a subscription. The next setup is already forming.
Disclosure: This article contains promotional content for Finversify, a SEBI-registered investment advisory. Past advisory performance does not guarantee future results. All trading in MCX gold futures involves risk of loss.